

Bitcoin traded at $78,788.45 in early September, reflecting a decline of 1.93% over the last 24 hours. Despite the slight drop, the world’s largest cryptocurrency continues to find support above key exponential moving averages on the daily chart.
Bitcoin dips 1.9% to $78,788, ETF inflows hit $161.8 million in 24 hours
By:Cointurk
Bitget offers one-stop trading for cryptocurrencies, stocks, and gold. Trade now!
A welcome pack worth 6200 USDT for new users! Sign up now!
Technical levels and resistance zones
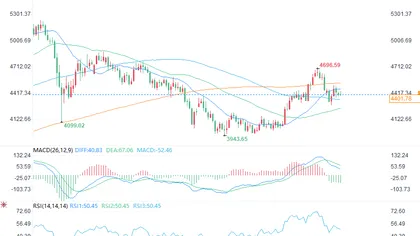
As of the latest data, Bitcoin remains above its 20-day, 50-day, 100-day, and 200-day exponential moving averages. The 20-day EMA holds at $76,715.73, while the 50-day sits at $72,047.78. The 100-day and 200-day EMAs currently stand at $70,254.03 and $72,739.62, respectively.
Analysts are watching the $80,000 mark as the next major resistance level. A clear push above this price could open up room for a climb towards $82,500. On the downside, the 20-day EMA at $76,715 provides an initial support area.
Should Bitcoin fall below the 20-day EMA, attention may shift to the $72,739 zone for further support. However, as long as BTC holds above these moving averages, traders broadly view the technical outlook as resilient.
EMA Period Current Price
| 20-day | $76,715.73 |
| 50-day | $72,047.78 |
| 100-day | $70,254.03 |
| 200-day | $72,739.62 |
Momentum indicators and open interest
Bitcoin’s 14-day relative strength index (RSI) reads 61.50, remaining above the key 50 level that generally indicates positive momentum. However, the RSI has pulled back from its recent highs, suggesting a moderation in upward momentum as BTC consolidates under $80,000.
Momentum on multiple time frames still shows strength above the 50 RSI mark, but signs of cooling are emerging as the daily reading slips from previous highs.
Data from CoinGlass reports that open interest in Bitcoin derivatives is near $53 billion, while trading volumes have seen several notable surges in recent weeks. These readings point to a market that remains actively engaged, especially in derivatives.
Mini dictionary: Relative Strength Index (RSI) – A technical indicator used to gauge momentum and identify overbought or oversold conditions in an asset, with values above 70 typically seen as overbought and below 30 as oversold.
ETF inflows boost demand
On-chain analytics platform Lookonchain, known for providing real-time fund flow data, highlighted ongoing institutional demand for Bitcoin. In its most recent update, Lookonchain noted net inflows of 2,038 BTC—valued at $161.83 million—into Bitcoin exchange-traded funds (ETFs) over the past 24 hours. The seven-day total inflows reached 11,093 BTC, worth $880.76 million.
ETF inflows in Bitcoin have totaled more than $880 million in the last week, reflecting continued demand from institutional investors even as the market faces resistance below $80,000.
Additional figures from digital asset analytics provider SoSoValue indicate that Bitcoin spot ETFs recorded $174.60 million in net inflows on September 4. Across all spot Bitcoin ETFs, total net assets reportedly reached $101.25 billion. Since launch, cumulative net inflows have amounted to $55.62 billion.
While the data from Lookonchain and SoSoValue covers different time frames, both sources indicate steady institutional participation through ETFs while Bitcoin trades below its key resistance area.
For now, traders remain focused on Bitcoin’s ability to break above $80,000 to confirm further upside or to hold above key support levels should a pullback occur.
0
0
Disclaimer: The content of this article solely reflects the author's opinion and does not represent the platform in any capacity. This article is not intended to serve as a reference for making investment decisions.
Understand the market, then trade.
Bitget offers one-stop trading for cryptocurrencies, stocks, and gold.
Trade now!
You may also like
Goldman Sachs Says: The Gold Bull Market Isn’t Over, $4,000 is a Buy-the-Dip Zone
汇通财经•2026/09/08 11:02
Ethereum Foundation sets December 2029 quantum resistance deadline, aligns with Google and Microsoft
Cointurk•2026/09/08 10:57
Big Bull Tom Lee’s $6,000 Scenario for Ethereum: He Listed 4 Catalysts! Here Are the Details
BitcoinSistemi•2026/09/08 10:30
Chainalysis estimates $9.4 billion in taxable crypto activity for France in 2025
Cointurk•2026/09/08 10:30
Crypto prices
More
Bitcoin
BTC
$78,402.89
-1.15%

Ethereum
ETH
$2,478.28
-0.40%

Tether USDt
USDT
$0.9997
-0.02%

BNB
BNB
$756.77
+1.73%

XRP
XRP
$1.4
-0.16%

USDC
USDC
$0.9999
-0.00%

Solana
SOL
$103.25
-1.68%

TRON
TRX
$0.3378
+0.34%

Hyperliquid
HYPE
$83.63
-4.83%

Zcash
ZEC
$1,149.99
-4.47%
How to buy BTC
Bitget lists BTC – Buy or sell BTC quickly on Bitget!
Trade now
Become a trader now?A welcome pack worth 6200 USDT for new users!
Sign up now