


Eli Lilly and Company (Derivatives) 價格歷史
 下載 CSV 數據
| 日期 | 開盤價* | 最高價 | 最低價 | 收盤價** | 交易量 |
|---|---|---|---|---|---|
2026-08-23 | $1,252.9 | $1,258.1 | $1,249.39 | $1,257.43 | $0.00 |
2026-08-22 | $1,255.18 | $1,255.88 | $1,249.44 | $1,252.9 | $0.00 |
2026-08-21 | $1,245.53 | $1,271.03 | $1,231.82 | $1,255.18 | $0.00 |
2026-08-20 | $1,279.65 | $1,283.6 | $1,243.7 | $1,245.53 | $0.00 |
2026-08-19 | $1,224.32 | $1,290.64 | $1,219.51 | $1,279.65 | $0.00 |
2026-08-18 | $1,184.38 | $1,227.44 | $1,182.6 | $1,224.32 | $0.00 |
2026-08-17 | $1,184.01 | $1,197.49 | $1,171.59 | $1,184.38 | $0.00 |
2026-08-16 | $1,178.53 | $1,185.96 | $1,177.67 | $1,184.01 | $0.00 |
2026-08-15 | $1,180.86 | $1,182.52 | $1,176.62 | $1,178.53 | $0.00 |
2026-08-14 | $1,209.87 | $1,209.95 | $1,172.87 | $1,180.86 | $0.00 |
2026-08-13 | $1,220.37 | $1,238.2 | $1,206.27 | $1,209.87 | $0.00 |
2026-08-12 | $1,216.22 | $1,225.94 | $1,196.65 | $1,220.37 | $0.00 |
2026-08-11 | $1,229.7 | $1,235.61 | $1,210.85 | $1,216.22 | $0.00 |
2026-08-10 | $1,183.33 | $1,230.78 | $1,174.13 | $1,229.7 | $0.00 |
2026-08-09 | $1,180.03 | $1,186.41 | $1,178.55 | $1,183.33 | $0.00 |
2026-08-08 | $1,186.21 | $1,188.14 | $1,176.81 | $1,180.03 | $0.00 |
2026-08-07 | $1,191.8 | $1,198.28 | $1,164.19 | $1,186.21 | $0.00 |
2026-08-06 | $1,177.73 | $1,226.37 | $1,169.08 | $1,191.8 | $0.00 |
2026-08-05 | $1,129.83 | $1,213.73 | $1,123.7 | $1,177.73 | $0.00 |
2026-08-04 | $1,123.88 | $1,132.68 | $1,112.35 | $1,129.83 | $0.00 |
2026-08-03 | $1,154.54 | $1,171.96 | $1,111.06 | $1,123.88 | $0.00 |
2026-08-02 | $1,149.19 | $1,161.7 | $1,147.71 | $1,154.54 | $0.00 |
2026-08-01 | $1,149.34 | $1,156.99 | $1,147.05 | $1,149.19 | $0.00 |
2026-07-31 | $1,158.58 | $1,162.59 | $1,121.26 | $1,149.34 | $0.00 |
2026-07-30 | $1,207.4 | $1,208.93 | $1,155.47 | $1,158.58 | $0.00 |
2026-07-29 | $1,222.24 | $1,227.13 | $1,205.99 | $1,207.4 | $0.00 |
2026-07-28 | $1,197.64 | $1,230.63 | $1,195.13 | $1,222.24 | $0.00 |
2026-07-27 | $1,198.55 | $1,208.93 | $1,188.78 | $1,197.64 | $0.00 |
2026-07-26 | $1,190.28 | $1,198.63 | $1,189.69 | $1,198.55 | $0.00 |
2026-07-25 | $1,195.56 | $1,202.5 | $1,189.77 | $1,190.28 | $0.00 |
- 1
- 2
- 3
- 4
- 5
歷史上的今天
下載 Eli Lilly and Company (Derivatives) 歷史數據


關於 Eli Lilly and Company (Derivatives) 價格歷史數據
Eli Lilly and Company (Derivatives) 價格歷史追蹤使加密貨幣投資者能夠方便地監控他們投資的表現。您可以輕鬆查看 Eli Lilly and Company (Derivatives) 隨時間推移的開盤價、最高價、收盤價以及交易量。此外,您還可以立即查看每日漲跌的百分比,進而輕鬆判斷波動較大的交易日。
根據我們的 Eli Lilly and Company (Derivatives) 價格歷史數據,其價值在 2026-10-01 飆升至歷史高點,超過 -- USD。另一方面,Eli Lilly and Company (Derivatives) 價格軌跡的最低點(通常稱為「Eli Lilly and Company (Derivatives) 歷史最低點」)出現在 2026-10-01 。如果有人在此期間購買了 Eli Lilly and Company (Derivatives) ,那麼他目前將獲得0% 的可觀收益。
按照設計,Eli Lilly and Company (Derivatives)的總供應量沒有限制,但其流通供應量為--個。
本頁面所示的價格均來自可信賴的數據提供商 Bitget。在檢查您的投資時,建議依賴單一數據來源,因為不同提供商之間的數值可能存在差異。
我們的歷史 Eli Lilly and Company (Derivatives) 價格數據集包括 1 分鐘、1 天、1 週和 1 個月的數據(開盤價/最高價/最低價/收盤價/成交量)。這些數據集經過嚴格測試,以確保一致性、完整性和準確性。該設計專門用於交易模擬和回測,可供免費下載,並即時更新。
Eli Lilly and Company (Derivatives) 歷史數據案例
以下是 Eli Lilly and Company (Derivatives) 歷史數據在 Eli Lilly and Company (Derivatives) 交易中的一些使用方法:
利用這些工具和資源,交易者可以深入研究 Eli Lilly and Company (Derivatives) 的歷史數據,獲得有價值的見解,並有可能改進他們的交易策略。
如何分析 Eli Lilly and Company (Derivatives) 蠟燭圖數據

Eli Lilly and Company (Derivatives) K 線圖表在水平軸上顯示時間,垂直軸上顯示價格數據,與折線圖和柱狀圖類似。K 線圖可能有兩種不同的顏色:綠色或紅色。綠色蠟燭表示在對應時間框架內價格上漲,而紅色蠟燭表示價格下跌。
K 線圖的簡單結構可以為用戶提供大量資訊。例如,技術分析師可能會使用 K 線圖數據來判斷可能的趨勢反轉。
根據 Eli Lilly and Company (Derivatives) 的歷史數據,當 Eli Lilly and Company (Derivatives) 市場呈現熊市或牛市趨勢時,保守型投資者可選擇使用保本產品,如 趨勢智盈 、雪球 或 鯊魚鰭 ,以把握當下的趨勢。
相反的,積極型投資者可能會根據自己對市場方向的判斷,透過投資非保本產品(如 區間獵手 )或採用 雙幣投資 產品來追求更高的回報。
在 Eli Lilly and Company (Derivatives) 呈現橫盤行情的情況下,利用 區間獵手 並選擇看漲的產品來利用些微上漲趨勢,或選擇看跌的產品來從緩和的下跌趨勢中獲利,可能會帶來更好的表現。
為了加深對從看漲市場趨勢中獲利的理解,建議您深入研究關於 牛市支撐帶 和 區間獵手 的資訊來源。
常見問題
什麼是加密貨幣歷史數據?
歷史數據是指與 Eli Lilly and Company (Derivatives)、以太幣等加密貨幣相關的過往資訊。這些數據包含價格、交易量、市值等多種指標。
加密貨幣歷史數據的意義在於其在加密貨幣交易中的多種應用。首先,它能讓交易者和投資者全面了解加密貨幣市場過去的表現,進而做出明智的選擇。
如何獲取加密數據紀錄
獲取加密數據紀錄的方法有很多種,但有些選項存在缺點。例如,在 Google Finance 或 Yahoo Finance 等平台上搜尋所需的加密貨幣代碼可能很難匯入到 Excel 中。此外,使用網路抓取技術可能會導致潛在的禁令和不可靠的數據檢索等問題。
為了確保準確性和可靠性,最推薦的方法是直接從 Bitget、Binance 或 CoinMarketCap 等信譽良好的加密貨幣交易所下載數據。這允許無縫整合到您的 Excel 電子表格中,提供值得信賴的加密數據紀錄源。
在 Bitget 中下載加密貨幣歷史數據的優勢
於 2023 年下半年,我們意識到用戶需要一個用於加密貨幣研究的集中式平台。作為一個長期以來以可靠數據聞名的機構,我們已經在很長一段的時間內為用戶提供了查看 免費 的歷史加密貨幣數據服務。因此,我們已成為用戶尋求全面、準確的加密貨幣市場資訊的首選平台。
透過下載 Bitget 提供的歷史數據,您不僅可以獲得豐富的資訊,還可以受益於我們在追蹤和分析加密貨幣市場風險方面的專業知識。這些數據可以作為您自己的個人研究或分析的寶貴起點。請隨時利用我們提供的歷史數據,以提升您對加密貨幣市場的全面了解。
歷史數據的格式是什麼?
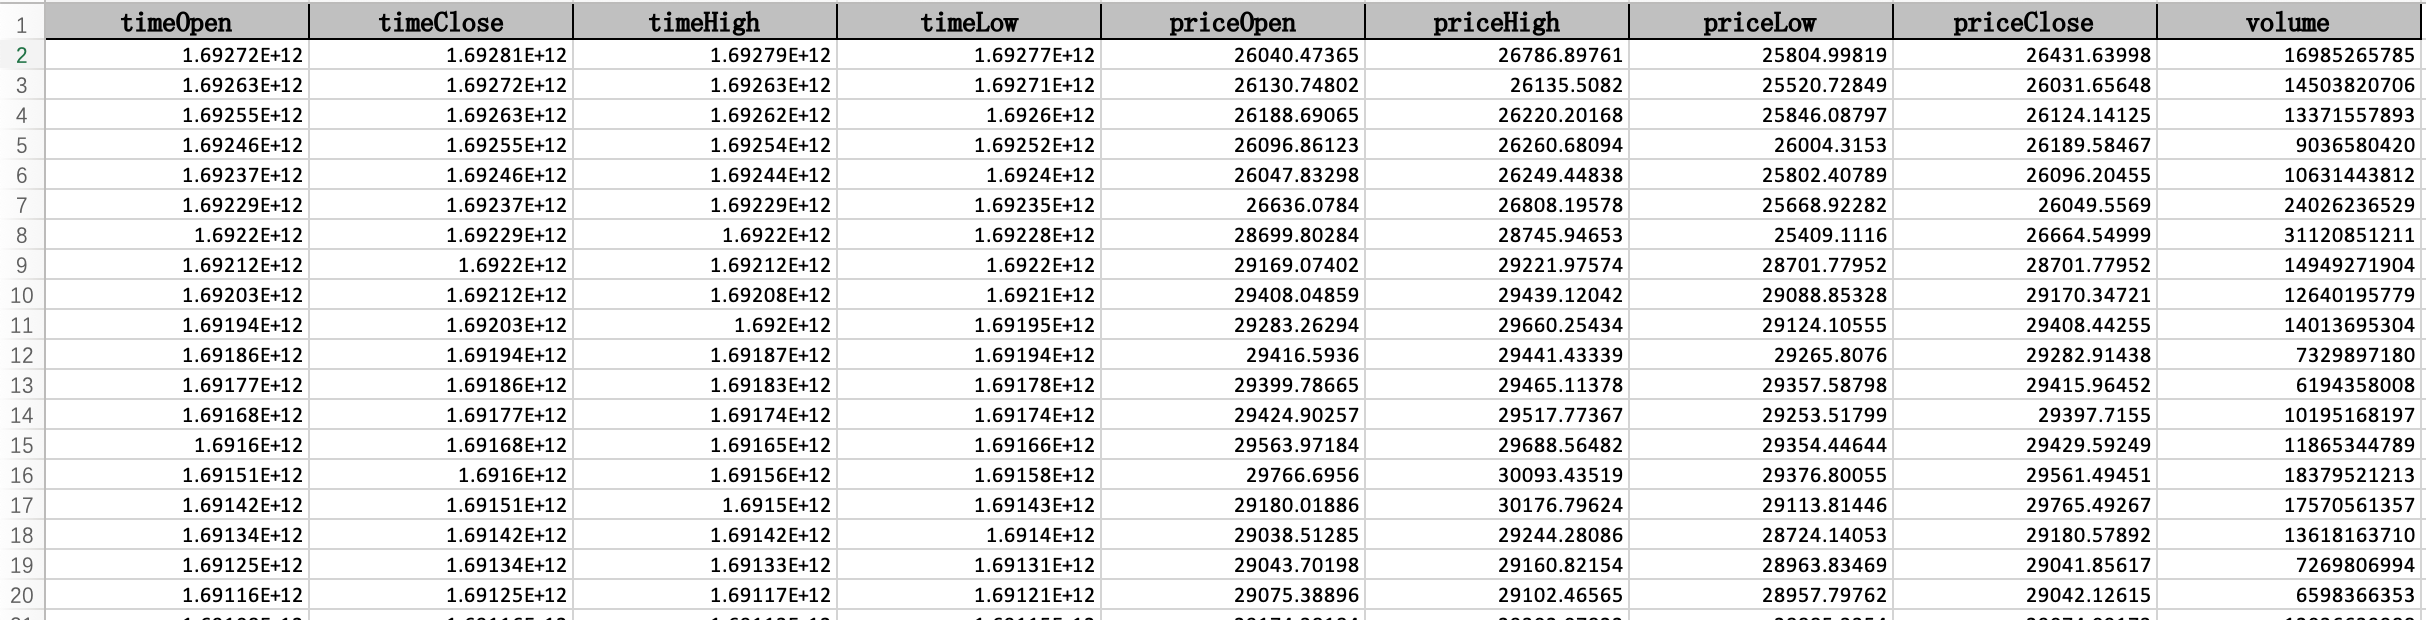
您只需點擊一下即可立即下載加密貨幣的歷史數據表格。這些數據會以 Excel 檔案的形式提供。如果您需要將數據轉換為不同的格式(例如從 CSV 轉到 JSON ),我們建議您使用 ConvertCSV 來完成。截圖:
歷史數據的更新頻率為何?
我們的加密貨幣價格歷史數據每天都會更新,就像市場通常在交易日結束後進行更新一樣。
歷史數據會以哪個時區顯示?
我們的所有歷史數據均以 GMT+0 時區顯示。
為什麼點擊下載按鈕時會出現「頻率過高」的錯誤提示?
為防止濫用,每種幣種的數據每天只能下載一次。請在第二天再次嘗試。