
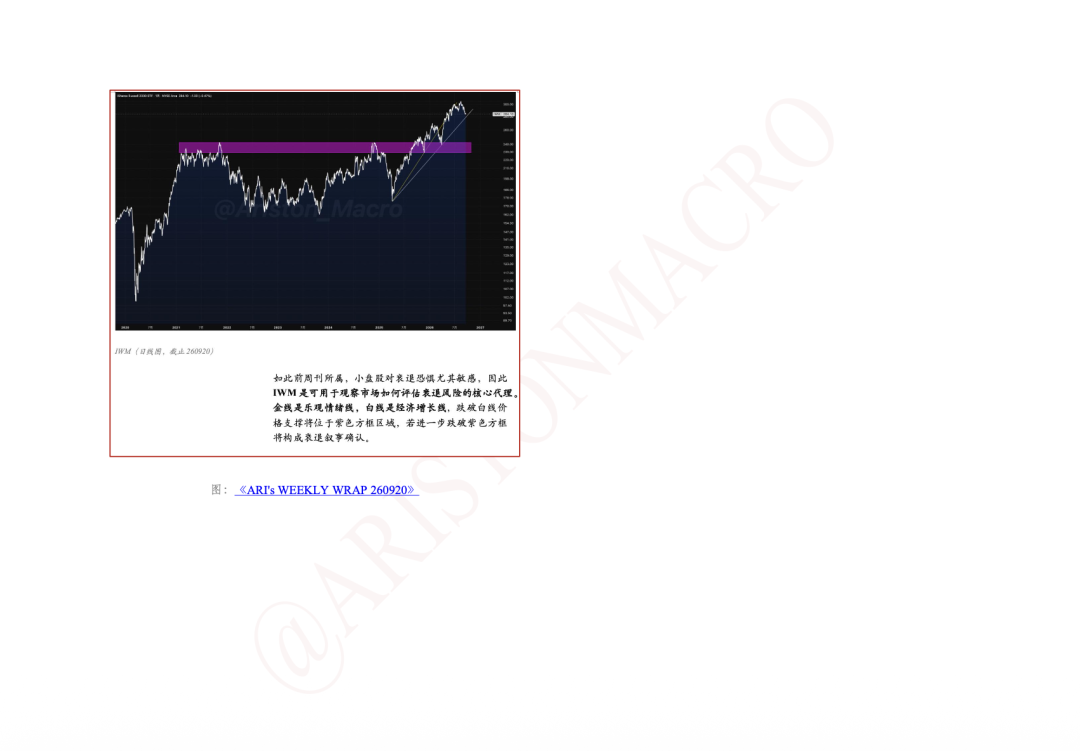
Is the US stock market pricing in a recession? Small-cap stocks have dropped below the white line and continue to slide downward.

Show original
Bitget offers one-stop trading for cryptocurrencies, stocks, and gold. Trade now!
A welcome pack worth 6200 USDT for new users! Sign up now!
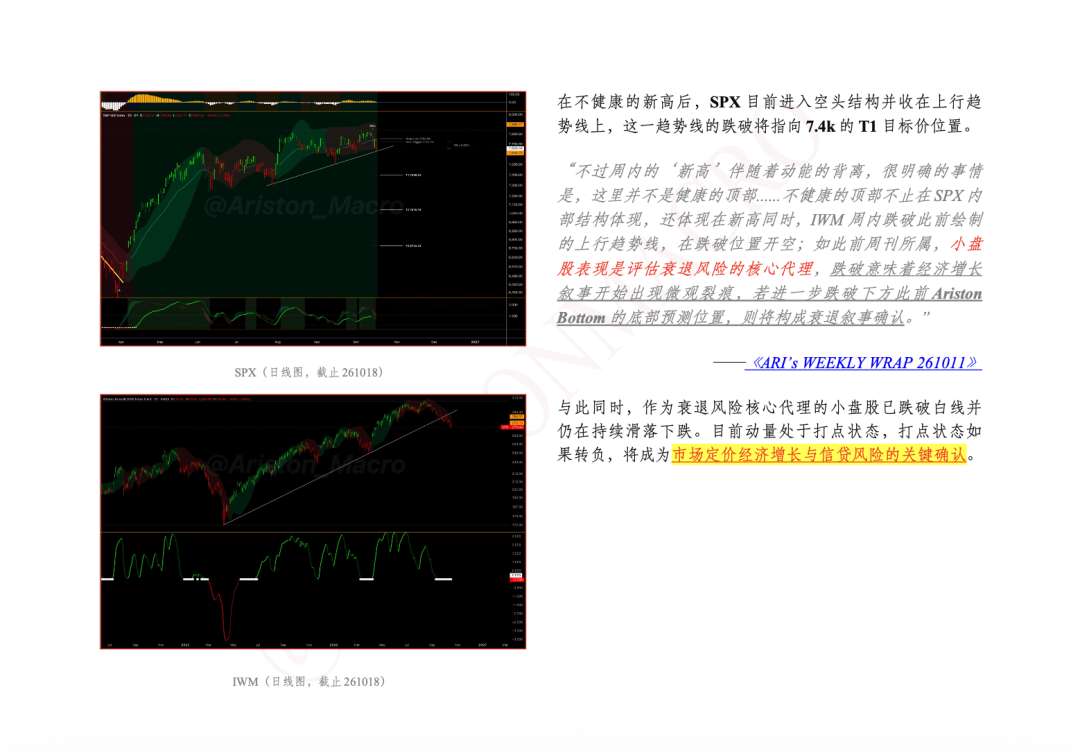
After an unhealthy new high, SPX has now entered a bearish structure and closed on the upward trend line. A break below this trend line will point to the T1 target price.
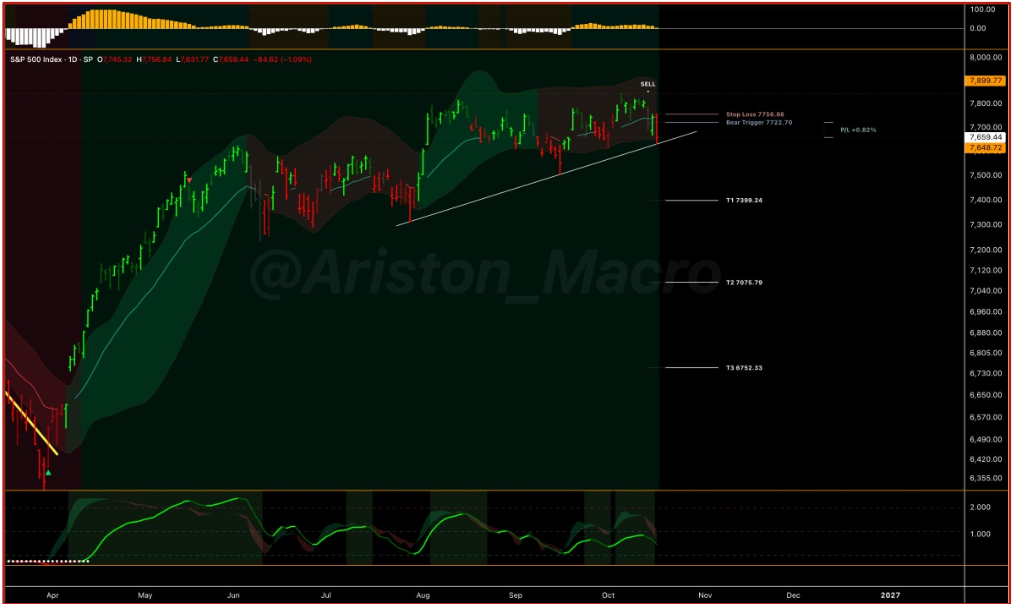
SPX (daily chart, up to 2026-10-18)
Meanwhile, small-cap stocks, a core proxy for recession risk, have fallen below the white line and continue their downward slide. Currently, momentum is at a stalling point; if the stalling status turns negative, this will be a key confirmation for market pricing of economic growth and credit risk.
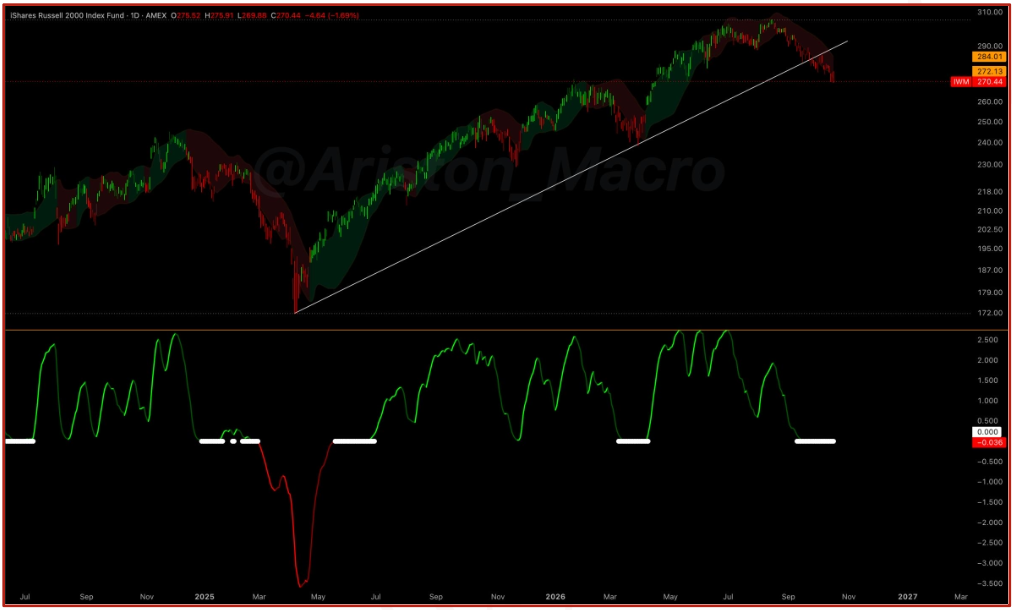
IWM (daily chart, up to 2026-10-18)
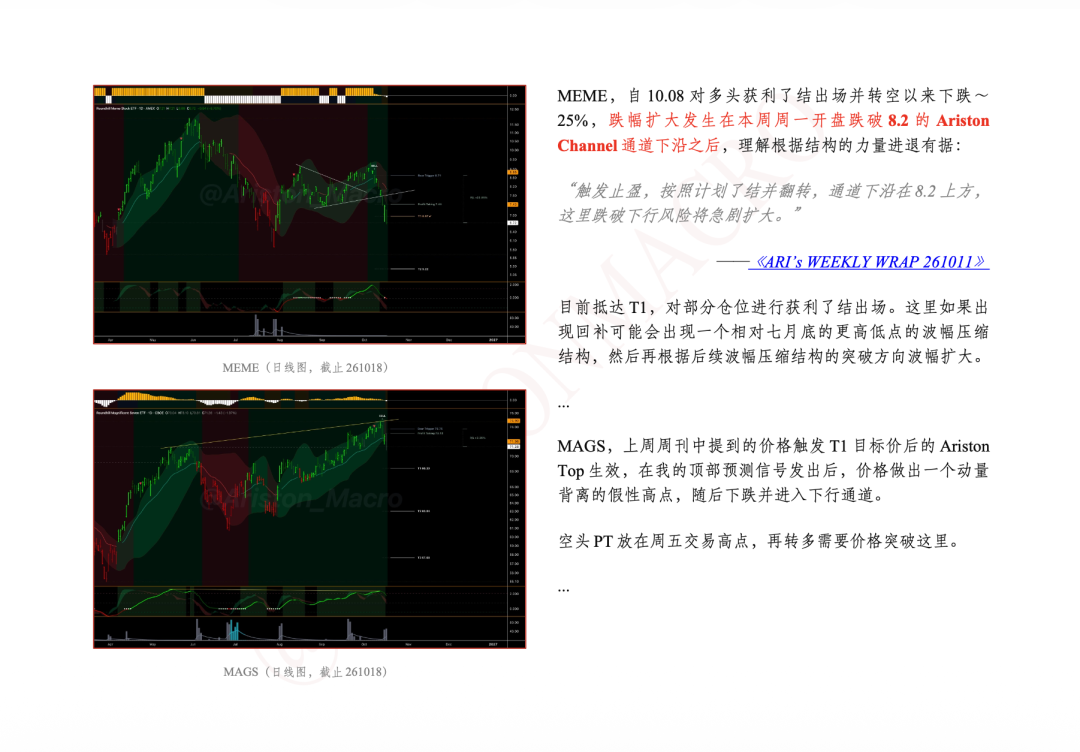
MEME has fallen about 25% since taking profit from long positions and turning bearish on 10.08. The wider drop happened after the price broke below 8.2 at the Ariston Channel's lower boundary on Monday. This is a rationale for making decisions based on structural strength:
MEME (daily chart, up to 2026-10-18)
Currently, it has reached T1, so partial profit-taking has been carried out. If a rebound occurs here, a relatively higher low with a volatility compression structure compared to late July could form, after which a breakout in the direction of the next volatility compression would expand the range.
...
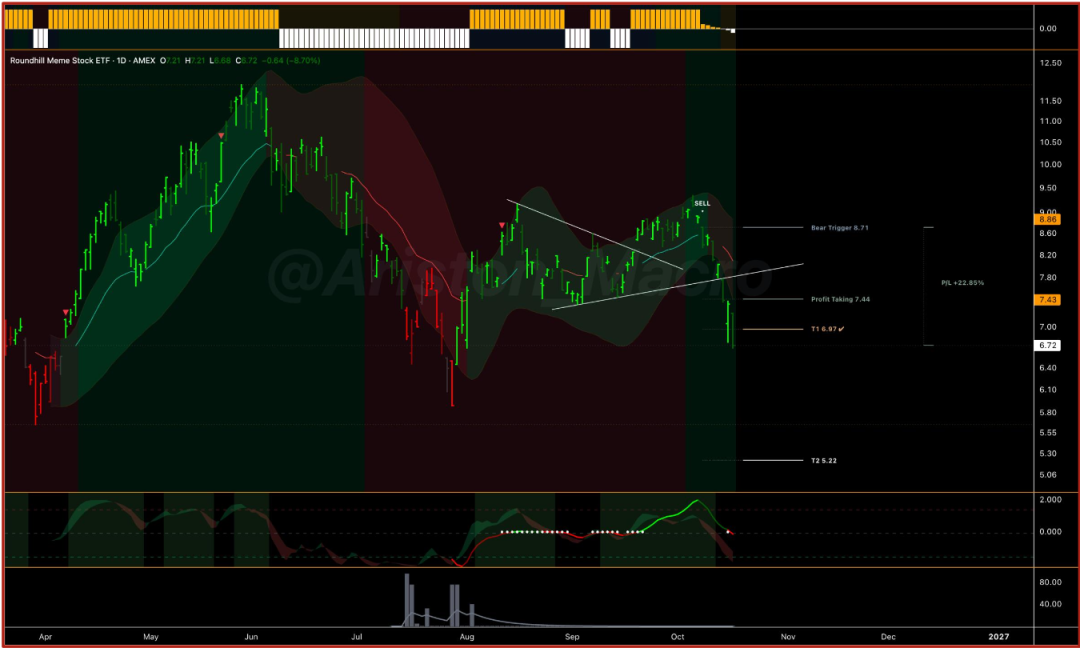
MAGS: After triggering the T1 target price mentioned in last week's report, the Ariston Top has been validated. Following the signal from my top prediction, price made a fake high with momentum divergence, then dropped and entered a downward channel. The bearish PT is set at Friday’s high; a bullish reversal would require a breakout here.
MAGS (daily chart, up to 2026-10-18)
...
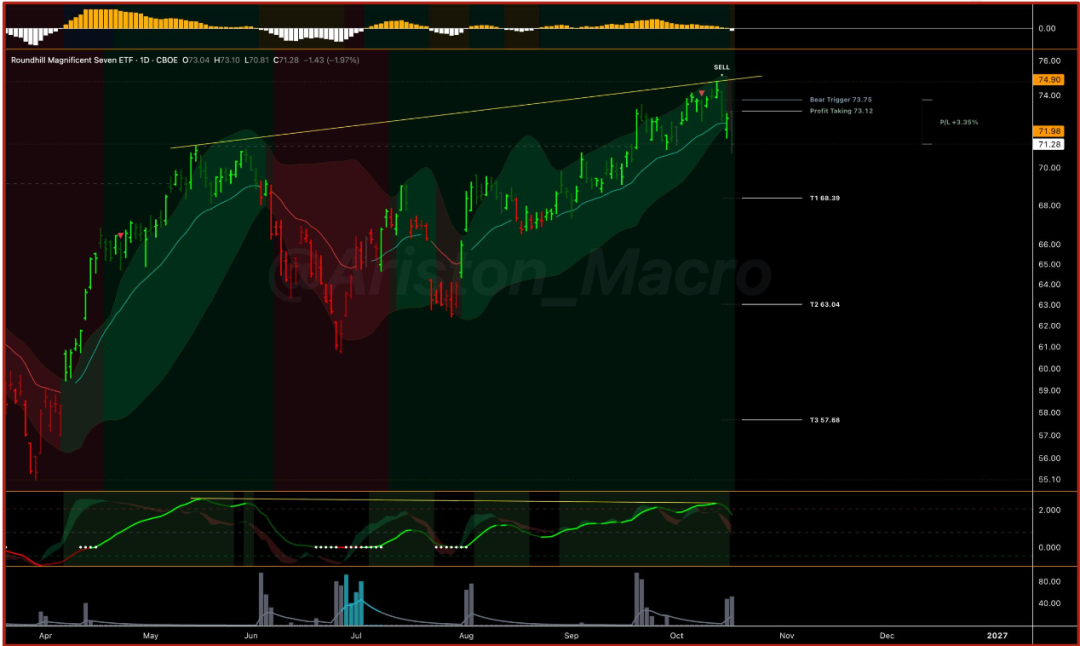
KWEB is approaching the channel’s upper boundary; pay attention to whether it can break through.
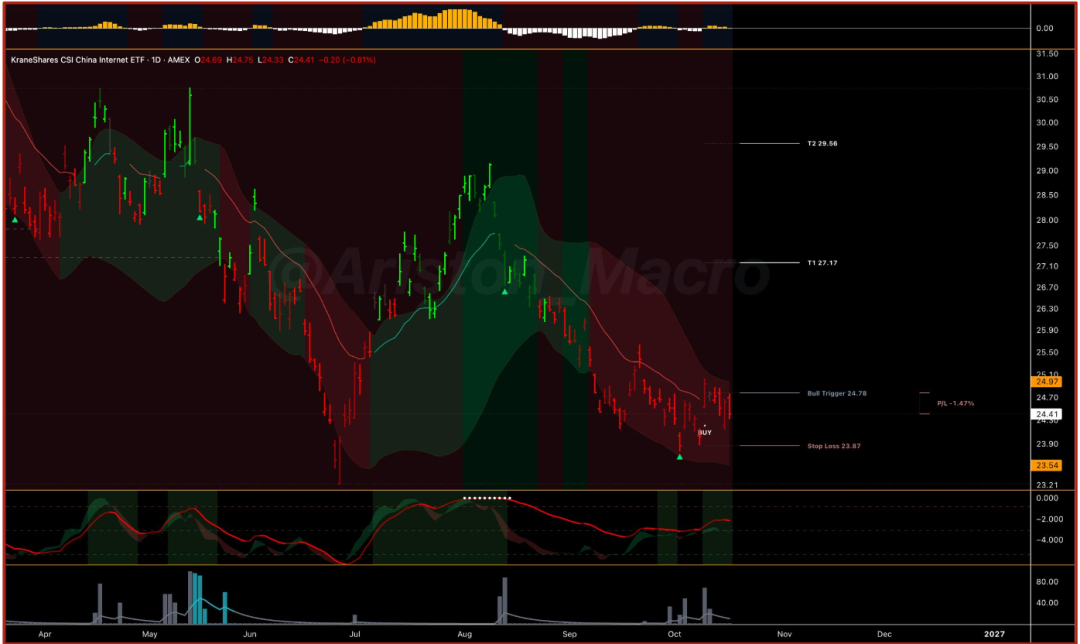
KWEB (daily chart, up to 2026-10-18)
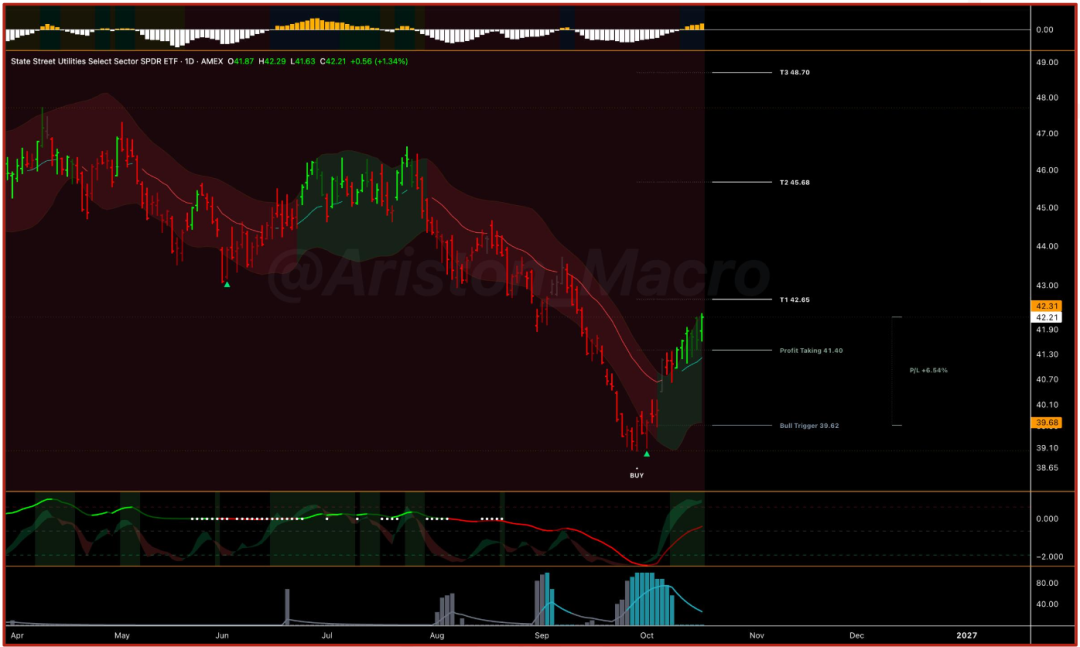
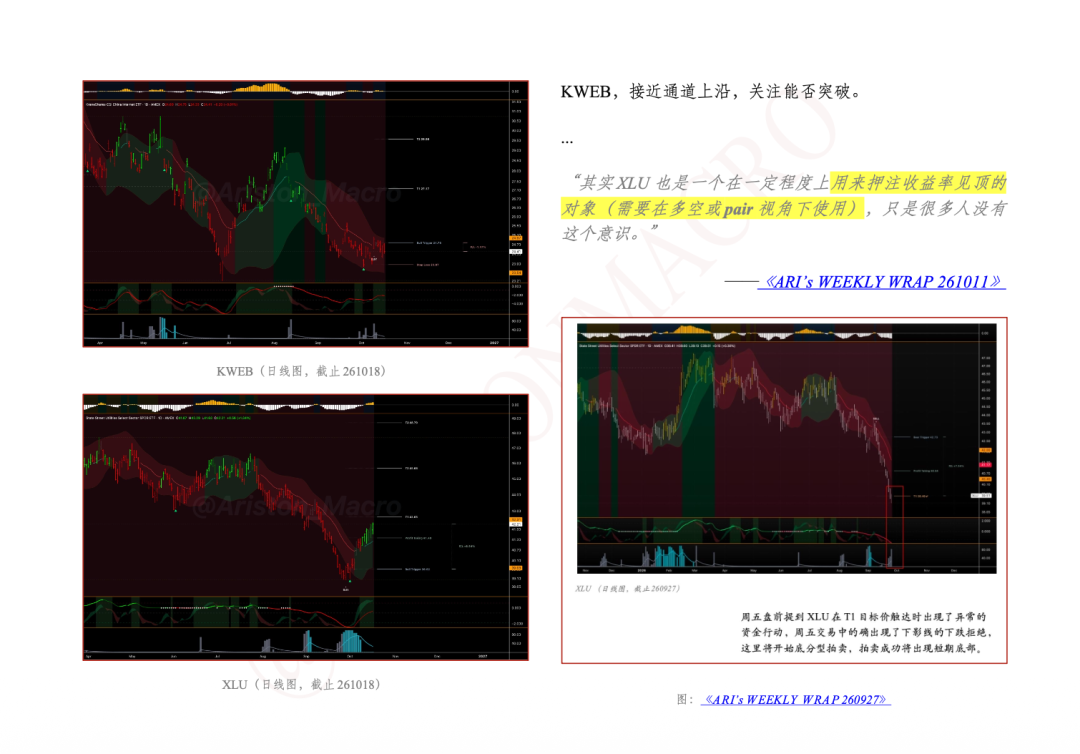
XLU (daily chart, up to 2026-10-18)
...
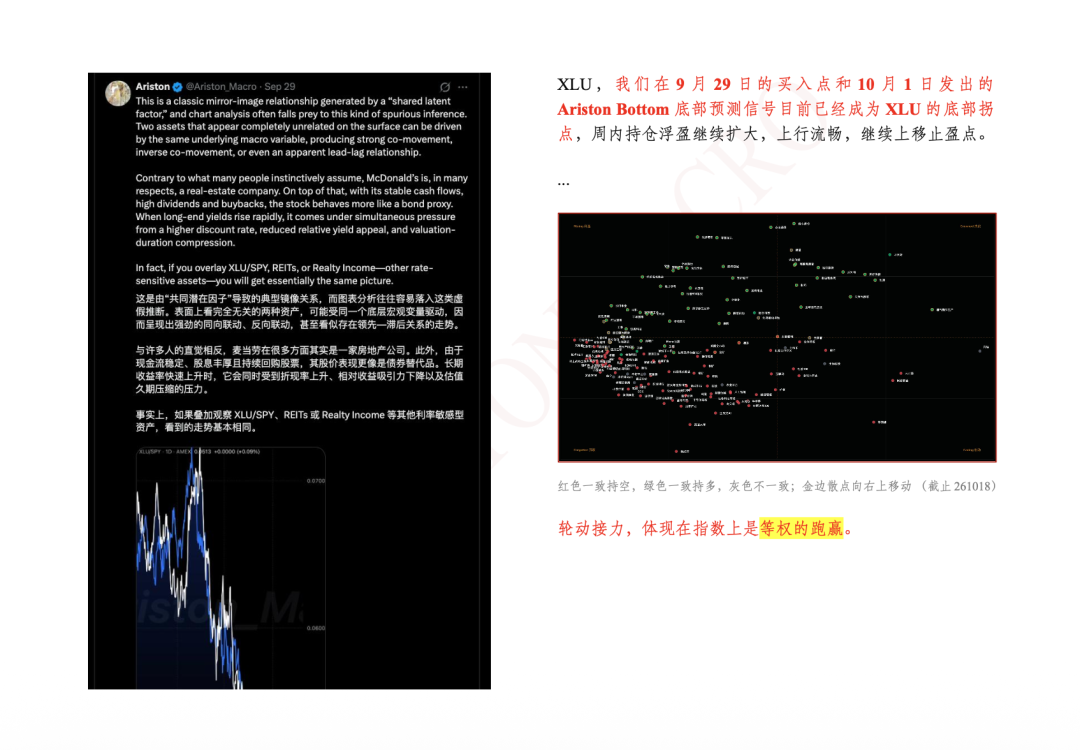
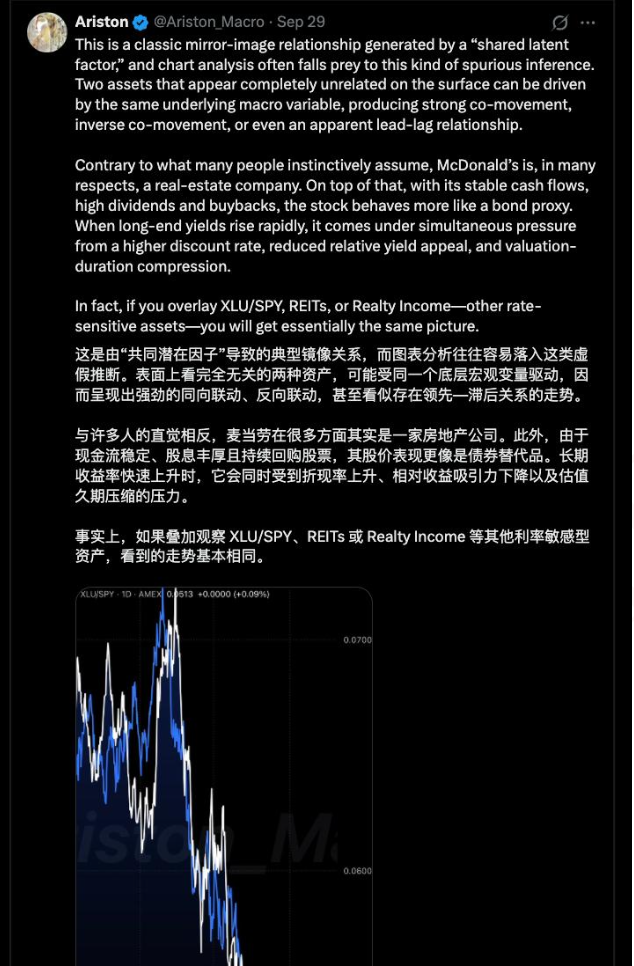
XLU, our September 29 buy point and the October 1 Ariston Bottom signal issued Ariston Bottom bottom prediction signal have now become XLU's pivot point. Unrealized gains continue to expand through the week, the upward move is smooth, and stop-loss levels continue to be trailed upwards.
...
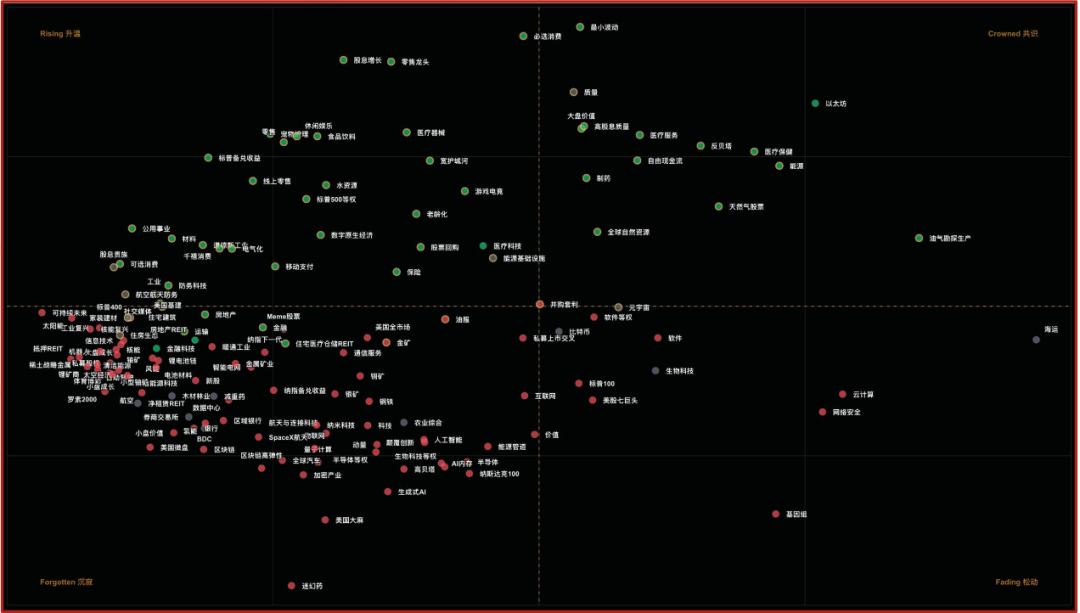
Red = unanimous bearish, Green = unanimous bullish, Gray = mixed. Gold-edged dots moving to upper right (as of 2026-10-18)
Rotation relay is reflected in the outperformance of equal-weighted indexes.
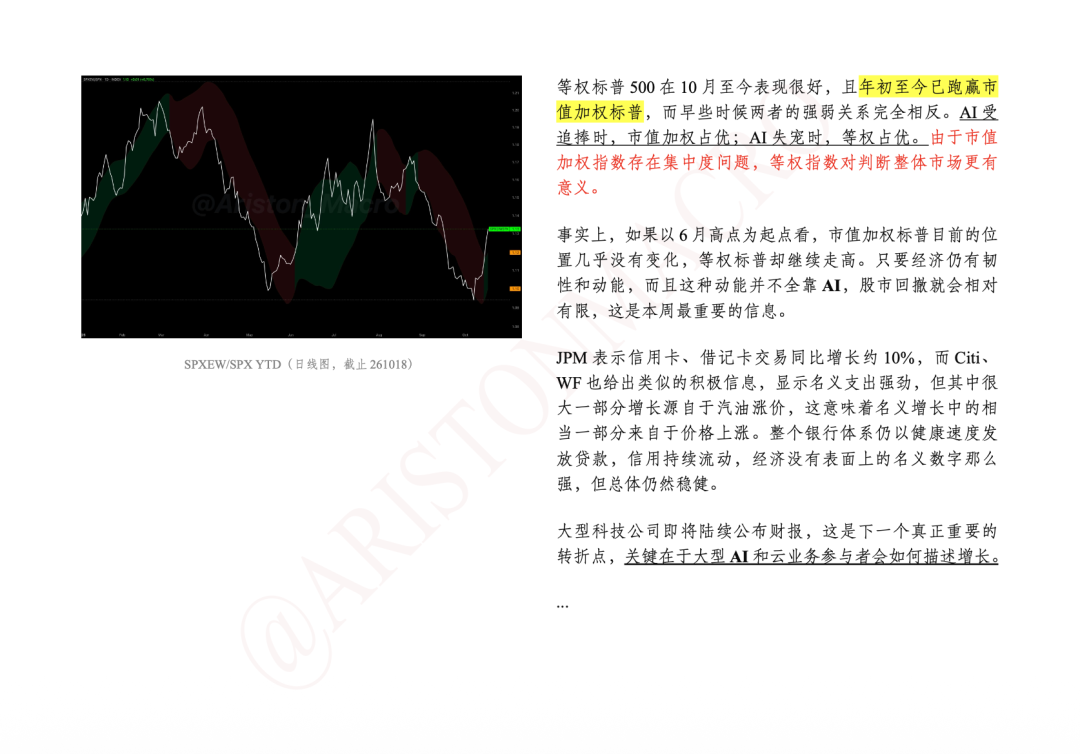
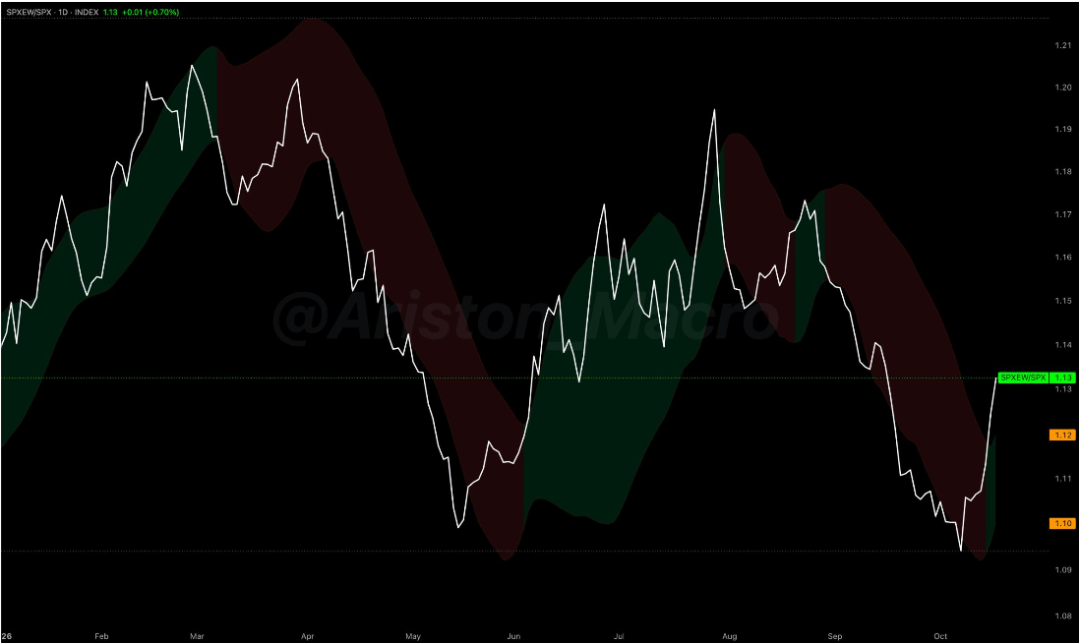
SPXEW/SPX YTD (daily chart, up to 2026-10-18)
Equal-weighted S&P 500 has performed very well since October, and has outperformed market-cap-weighted S&Psince the start of the year, while earlier the relative strength between the two was reversed. When AI was favored, market-cap weighted outperformed; when AI fell out of favor, equal-weighted outperformed. Due to concentration issues in market-cap indexes, equal-weighted indexes give a better sense of the overall market.
In fact, since the June high, the position of the market-cap-weighted S&P has barely changed, while equal-weighted S&P has continued to move higher. As long as the economy remains resilient and dynamic—and that momentum isn't solely driven by AI—stock market pullbacks will remain relatively limited. This is the most important message this week.
JPM reports that credit card and debit card transactions grew about 10% year-over-year, with Citi and WF also giving similar positive guidance. This shows strong nominal spending, but much of the increase came from higher gasoline prices, meaning a significant part of nominal growth comes from price increases. The entire banking system is still lending at a healthy pace, credit continues to flow, the economy isn't as strong as nominal figures suggest, but overall it remains solid.
Large tech companies will soon release their earnings, marking the next truly important inflection point. The key is how major AI and cloud business players describe growth.
...

0
0
Disclaimer: The content of this article solely reflects the author's opinion and does not represent the platform in any capacity. This article is not intended to serve as a reference for making investment decisions.
Understand the market, then trade.
Bitget offers one-stop trading for cryptocurrencies, stocks, and gold.
Trade now!
You may also like
BUZZ-Community Trust Bancorp shares fall after Q3 earnings release
路透社•2026/10/21 17:36
Gold price steadies near one-week low as oil-driven inflation fears grow
Mining.com•2026/10/21 17:18


Arrived STR 2 Announces $0.010 Per-Share Dividends for Pinkshell and Tiara, $0.098 for Byers
Bitget•2026/10/21 17:05
Crypto prices
More
Bitcoin
BTC
$84,611.89
+2.23%

Ethereum
ETH
$2,515.29
+2.67%

Tether USDt
USDT
$0.9993
+0.04%

BNB
BNB
$750.23
+1.82%

XRP
XRP
$1.39
+4.34%

USDC
USDC
$0.9999
+0.00%

Solana
SOL
$108.6
+1.84%

TRON
TRX
$0.3328
+0.56%

Zcash
ZEC
$1,363.51
+11.85%

Hyperliquid
HYPE
$81.68
+1.76%
How to buy BTC
Bitget lists BTC – Buy or sell BTC quickly on Bitget!
Trade now
Become a trader now?A welcome pack worth 6200 USDT for new users!
Sign up now