Spot Bitcoin ETFs shed $681.10 million last week, the heaviest weekly outflow in three months. Claude AI predicts BTC holds its recovery structure anyway, because that figure was produced by two sessions rather than a trend.
The week was violent in the middle and quiet at both ends. Bitcoin was rejected at $87,000 on Monday, then slid to a two-week low of $80,400 by Thursday evening. It recovered from there and closed the week back above $83,000.
BTC trades at $83,790, effectively flat on the day, with a market cap of $1.68 trillion. The token is down just 1.9% over seven days, a mild figure for a week that produced the largest fund outflows since June. This mismatch is the starting point. Price absorbed almost $700 million of selling and gave up less than 2%.
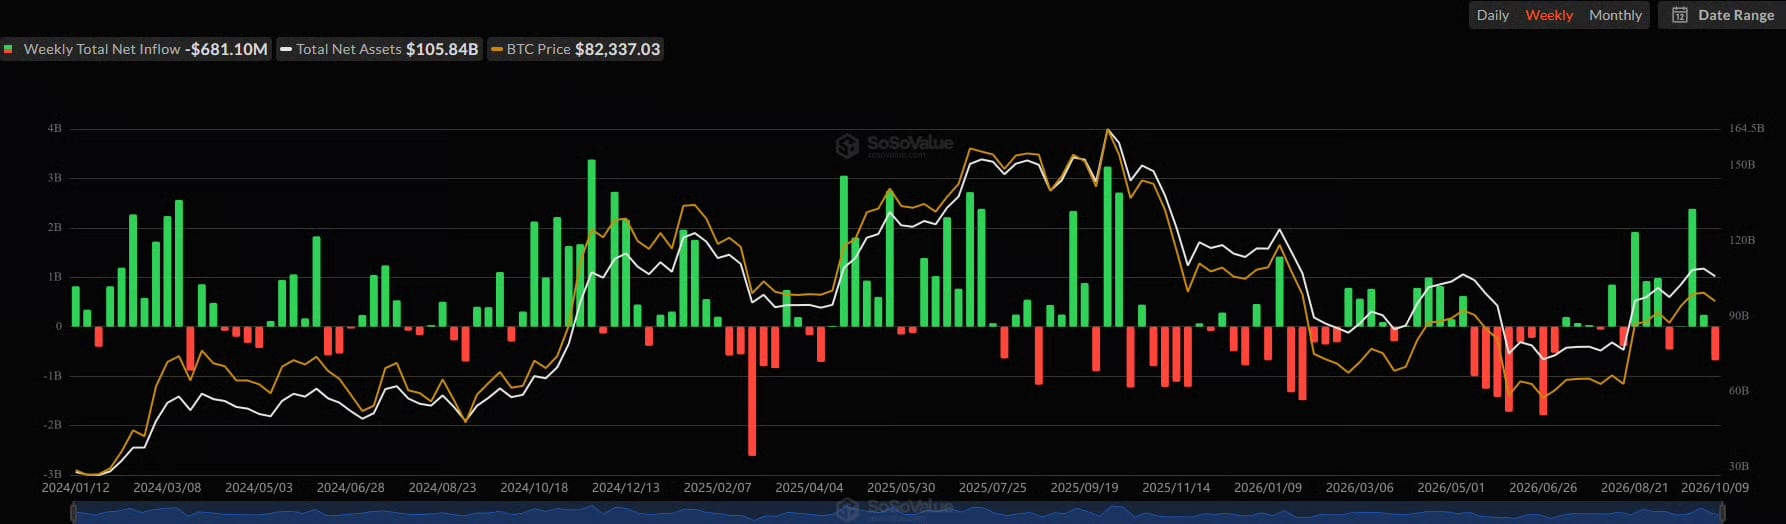
Bitcoin ETFs Flow
Two Sessions Account for the Entire Weekly Outflow Figure
Break the week down, and the headline loses most of its weight. Monday saw roughly $90 million leave. Tuesday reversed it with $118.86 million of inflows. Then came Wednesday at $487.07 million out and Thursday at $244.13 million out. Friday closed green at $21.13 million.
Those two midweek sessions total $731.20 million. The other three days combined for a net inflow of about $50 million.
So the week was not a steady exit. It was a two-day event around Bitcoin’s rejection at $87,000 and its fall to $80,400 on Thursday.
Context matters in size, too. The last full week of June saw $1.79 billion pulled, more than double this figure. Cumulative net inflows slipped from $57.79 billion to $57.11 billion, a dent of roughly 1.2%. Total net assets still stand at $105.84 billion.
Ethereum Funds Carry the Weaker Signal of the Two
The Bitcoin number drew the headlines. The Ethereum number deserves them more. ETH ETFs posted five consecutive red days, extending an existing four-day streak. They have not recorded a single green session since September 28.
The daily figures were $50.76 million, $201.89 million, $160.77 million, $72.54 million, and $56.10 million, adding to roughly $542 million. Cumulative net totals fell from $13.95 billion to $13.26 billion across the run.
Friday is where the two diverge. BlackRock’s IBIT took in $22.4 million while BlackRock’s ETHA lost $56.1 million on the same day.
Bitcoin funds found a bid at the bottom of the week. Ethereum funds did not. ETH sits at $2,553 after a midweek slide to around $2,400, still down 5.2% over seven days against Bitcoin’s 1.9%.
That gap, not the weekly total, is what the flow data actually shows.
Claude AI Predicts BTC Levels After a Bullish MVRV Crossover
Two signals argue against reading the outflows as a top.
Glassnode shows MVRV momentum turning positive, with the ratio crossing back above its 365-day mean. The same crossover appeared in 2019 and in 2023, both of which preceded extended advances. MVRV remains well under its all-time mean of 1.8, so the metric is not stretched.
Analyst Benjamin Cowen points to the weekly close above $83,000, arguing the burden of proof stays with the bears until multiple weekly closes land below it.
Claude AI predicts BTC will be decided at these levels:
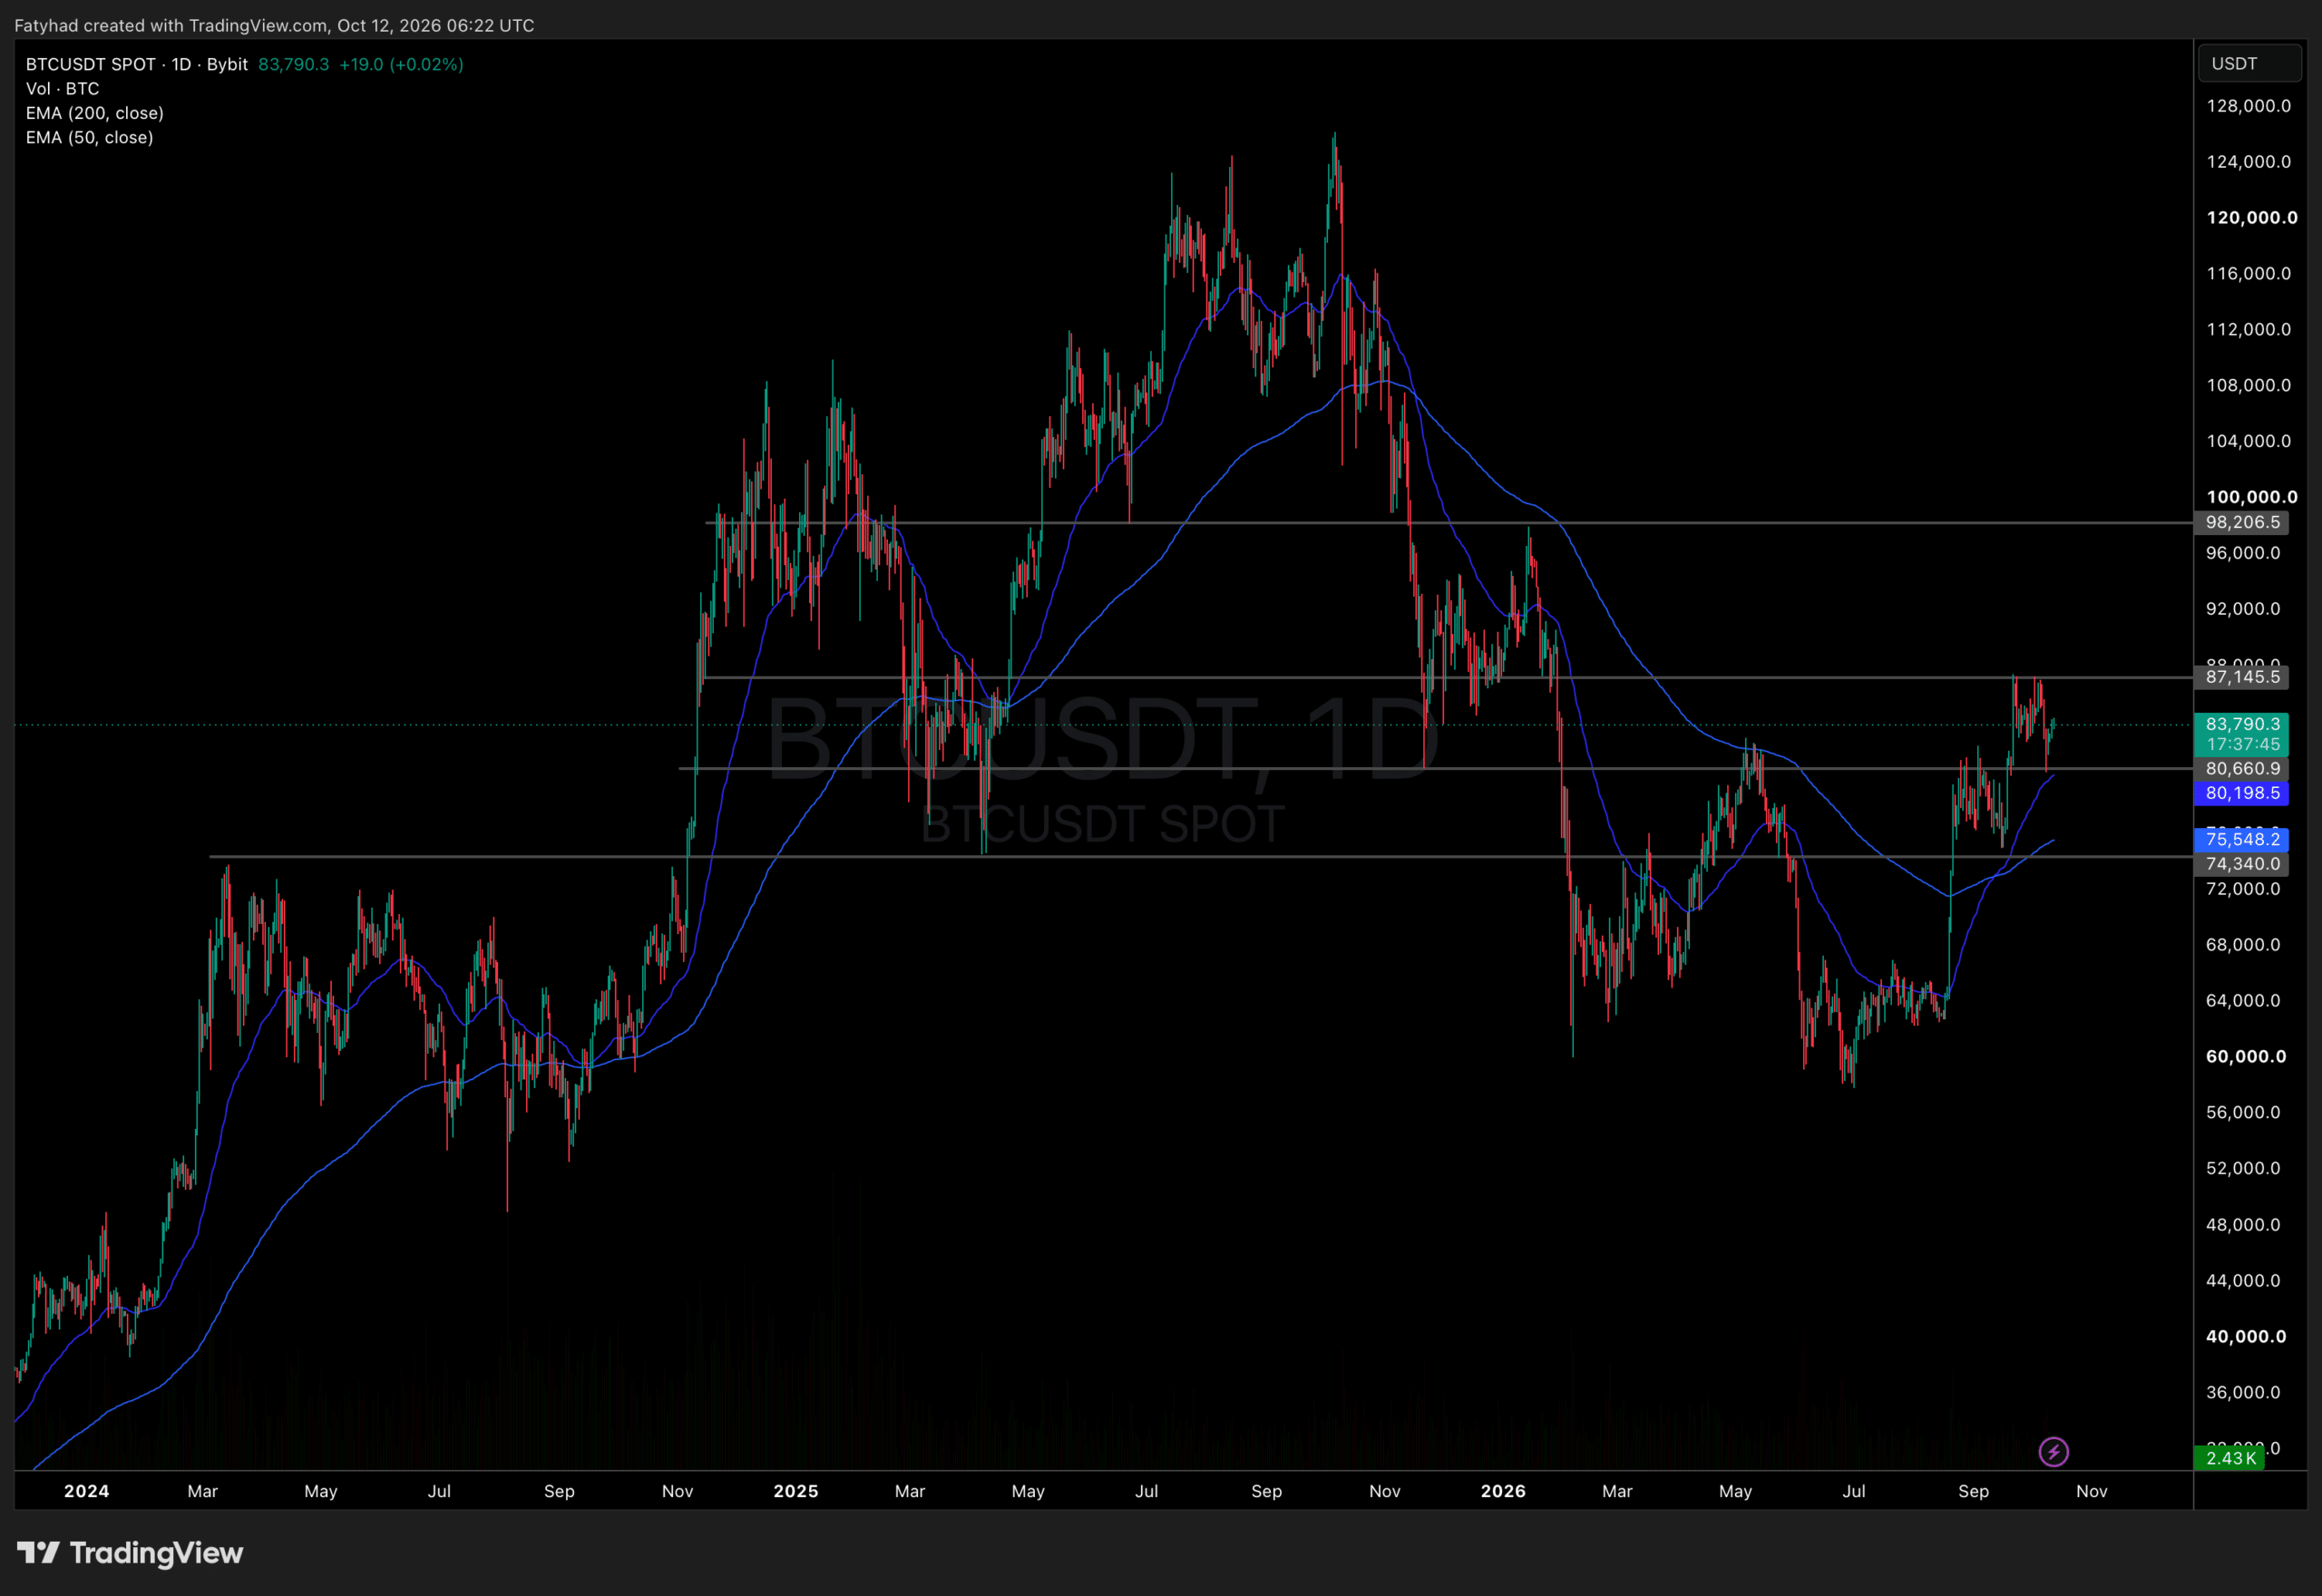
BTCUSDT Chart 1D
- The floor: $80,660. Defended on Thursday’s drop to $80,400. Below it sits the 50-day EMA at $80,198.
- The structural line: $75,548. The 200-day EMA, and the level that would end the recovery outright.
- The ceiling: $87,145. Rejected four times in two weeks. Clearing it ends the sequence of lower highs.
Watch the weekly close rather than the daily candles. Cowen’s point stands as long as Bitcoin keeps finishing weeks above $83,000.
A failed week there, combined with a second heavy outflow week, would turn a two-day flush into something structural.