
Humana stock closes down 2.37%; Medicare ratings upgrade reported after the bell

Humana stock presents a neutral daily chart, with Thursday’s close at $387.12 below the 20-session EMA but above the 50-session EMA. The hourly chart adds bearish pressure.
On Thursday, October 8, 2026, Humana opened at $396.03, traded between a low of $375.86 and a high of $399.19, and closed at $387.12, against a previous close of $396.51. Volume was 2,658,300 shares. Prices and technical indicators are from Twelve Data.
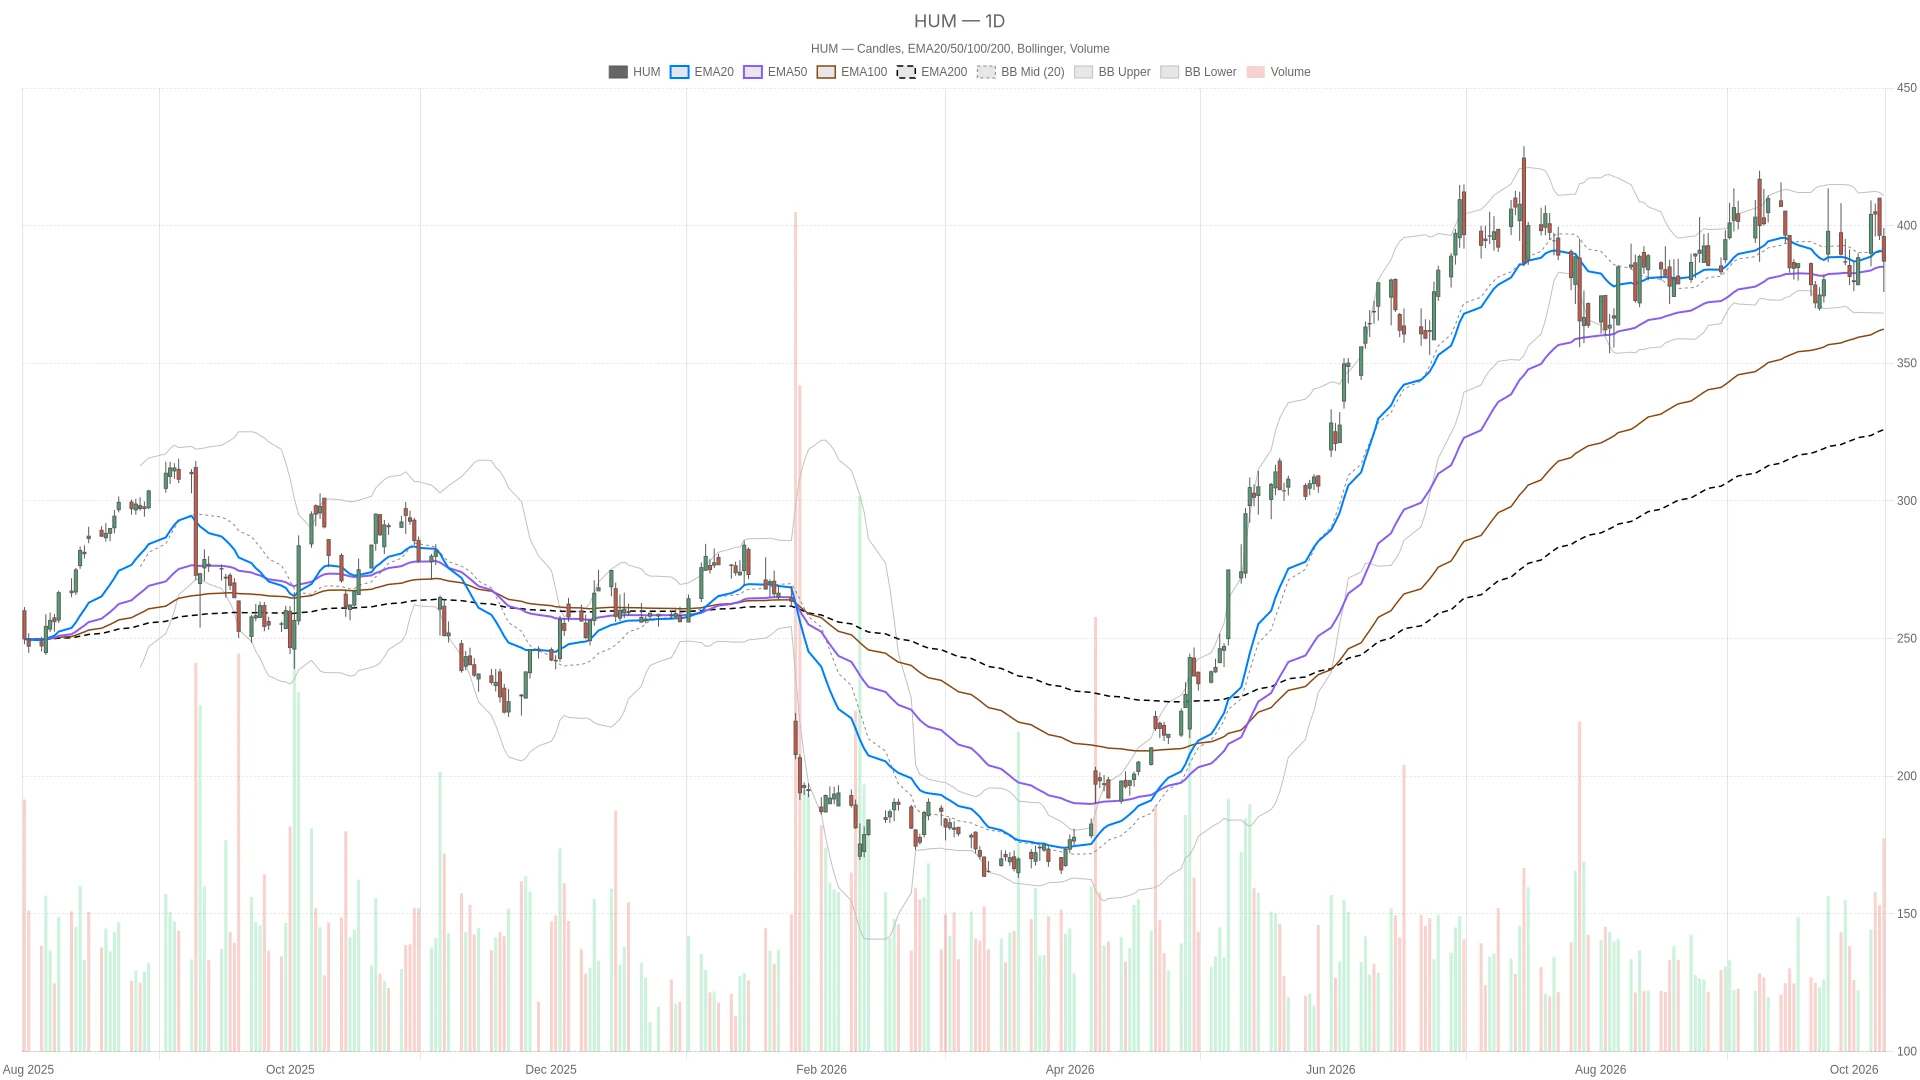 HUM — daily chart with candlesticks, EMA20/EMA50 and volume.
Summary
Key takeaways
- Humana closed Thursday at $387.12, below the 20-session EMA ($390.48) but above the 50-session EMA ($385.1).
- Daily RSI14 is 48.33, below the neutral 50; the daily MACD histogram is positive at 0.79, with the MACD line (1.2) above its signal (0.41).
- The hourly chart is bearish: price sits below all three hourly EMAs, hourly RSI14 is 44.05, and the hourly MACD line (-2.25) is below its signal (-0.3).
- Daily ATR14 increased to $14.69 from $14.02 in the preceding session.
- A report published after Thursday’s close said Humana’s largest Medicare Advantage contract rose from 3.5 to 4 stars; another report on Friday said 95% of Medicare members are in 4-star-plus plans.
Humana stock: a neutral daily bias with conflicting momentum
The close sits below the 20-session EMA at $390.48 but above the 50-session EMA at $385.1. The 200-session EMA stands at $326.85. That positioning leaves near-term resistance overhead while preserving support at the intermediate average; it is not a fully bullish alignment.
However, daily momentum is mixed rather than uniformly bearish. RSI14 stands at 48.33, below the neutral 50 threshold. The MACD line is 1.2, above its signal at 0.41, with a positive histogram of 0.79. MACD therefore retains a positive signal despite the RSI’s weaker position.
The daily Bollinger mid-band at $389.53 also sits above the close, between the lower band at $368.18 and upper band at $410.88. This adds a volatility caution to a setup without clear directional agreement.
Hourly weakness limits the bullish reading for Humana
In contrast, the hourly chart is less supportive. The session close sits below all three hourly EMAs: the 200-hour at $389.89, the 50-hour at $392.11, and the 20-hour at $392.43. Price is below all three, even though the 20-hour EMA sits above the 50-hour and the 200-hour.
Hourly RSI14 is 44.05, below 50. The MACD line at -2.25 is below its signal at -0.3, while the histogram is -1.96. This negative hourly signal weakens the daily MACD’s positive reading and keeps the main thesis neutral rather than bullish.
Meanwhile, the 15-minute chart offers only execution context. The close sits above its 20-period EMA at $386.69 but below the 50-period EMA at $390.92 and 200-period EMA at $392.34. RSI14 is 49.2, below 50. Its MACD line at -1.68 is above the signal at -2.53, with a positive histogram of 0.86. That short-term signal does not override the hourly weakness.
Medicare ratings reports belong to the later news backdrop
A report published after Thursday’s close said Humana’s largest Medicare Advantage contract covered more than 2 million members. It reported an increase from 3.5 stars to 4, putting the contract above the bonus threshold.
On Friday, October 9, a report said that Humana had 95% of Medicare members in 4-star-plus plans. Another Friday report linked stock gains to a Medicare Star Ratings boost from Evercore. A report described Humana as the top beneficiary of the 2027 Medicare star ratings.
A report also noted a 15% premarket gain on Friday and a Medicare upgrade. That was the later premarket figure, not Thursday’s session return or an updated chart price. All these reports were published after Thursday’s session.
Bullish and bearish conditions for Humana stock
When trading resumes, the daily pivot sits at $387.39, with first resistance at $398.92 and first support at $375.59. These levels are calculated from the completed daily candle and apply to the next session.
A bullish case would require holding the 50-session EMA at $385.1 and clearing the daily pivot at $387.39. Above that, the Bollinger mid-band at $389.53 and 20-session EMA at $390.48 are successive hurdles. Acceptance above those levels, alongside an hourly MACD line above its signal, would support a stronger bullish reading. Daily first resistance at $398.92 would then be the next reference.
Conversely, a break below the 50-session EMA at $385.1 would undermine that case. The session low at $375.86 comes before daily first support at $375.59, followed by the lower Bollinger band at $368.18. For short-term timing when trading resumes, the 15-minute pivot is $386.63, with first resistance at $388.89 and first support at $385.07.
Overall, the $387.12 session close lies between daily support at the $385.1 EMA and resistance at the $390.48 EMA. ATR14 at $14.69 keeps volatility central to the assessment. The unresolved question is whether the later Medicare news will be matched by price acceptance above the chart’s overhead levels.
FAQ
What is the daily trend structure for Humana stock?
Humana’s daily chart is neutral. Thursday’s close at $387.12 sits below the 20-session EMA at $390.48 but above the 50-session EMA at $385.1. Daily RSI14 at 48.33 is below the neutral 50, though the MACD retains a positive signal with the line at 1.2 above its signal at 0.41 and a positive histogram of 0.79.
What do the Medicare star ratings reports say?
A report published after Thursday’s close said Humana’s largest Medicare Advantage contract, covering more than 2 million members, increased from 3.5 to 4 stars, placing it above the bonus threshold. Another report on Friday, October 9, said that 95% of Humana’s Medicare members are in 4-star-plus plans. These reports were published after the session.
What are the key levels to watch for Humana stock?
The daily pivot for the next session is $387.39, with first resistance at $398.92 and first support at $375.59. The 50-session EMA at $385.1 and the 20-session EMA at $390.48 are key reference points. The Bollinger mid-band sits at $389.53, with the lower band at $368.18 and upper band at $410.88. Daily ATR14 is $14.69.
{"@context":"","@type":"FAQPage","mainEntity":[{"@type":"Question","name":"What is the daily trend structure for Humana stock?","acceptedAnswer":{"@type":"Answer","text":"Humana's daily chart is neutral. Thursday's close at $387.12 sits below the 20-session EMA at $390.48 but above the 50-session EMA at $385.1. Daily RSI14 at 48.33 is below the neutral 50, though the MACD retains a positive signal with the line at 1.2 above its signal at 0.41 and a positive histogram of 0.79."}},{"@type":"Question","name":"What do the Medicare star ratings reports say?","acceptedAnswer":{"@type":"Answer","text":"A report published after Thursday's close said Humana's largest Medicare Advantage contract, covering more than 2 million members, increased from 3.5 to 4 stars, placing it above the bonus threshold. Another report on Friday, October 9, said that 95% of Humana's Medicare members are in 4-star-plus plans. These reports were published after the session."}},{"@type":"Question","name":"What are the key levels to watch for Humana stock?","acceptedAnswer":{"@type":"Answer","text":"The daily pivot for the next session is $387.39, with first resistance at $398.92 and first support at $375.59. The 50-session EMA at $385.1 and the 20-session EMA at $390.48 are key reference points. The Bollinger mid-band sits at $389.53, with the lower band at $368.18 and upper band at $410.88. Daily ATR14 is $14.69."}}]}
Article produced with the assistance of artificial intelligence and reviewed by the editorial team.
Disclaimer: The content of this article solely reflects the author's opinion and does not represent the platform in any capacity. This article is not intended to serve as a reference for making investment decisions.
You may also like
AI and Quantum: Trump's $6 Billion Plan Could Also Impact Bitcoin
Wall Street giants to release financial reports next week: stock trading revenue expected to approach $19 billion, "everyone is a winner" may be a thing of the past
According to analyst expectations compiled by Bloomberg, the combined equity trading revenue of the five major U.S. banks in the third quarter will approach $19 billion, but fixed income trading revenue is expected to drop to its lowest point of the year, and M&A activity has also cooled. Meanwhile, AI-driven cash optimization tools may lead to deposit outflows, sparking concerns about bank stocks in the market. Analysts believe that while the profit performance of each bank may further diverge, market concerns about the impact of AI may be overblown.
EU regulator wants proof tokenized collateral survives a crisis
Ripple Prime’s ETF Push Tests the Rise of Nonbank Financing
Crypto prices
More


