
When the Bond Market Takes Over the Oil Narrative: 10-Year US Treasury Yield and WTI Crude Oil Synergy Reaches Highest Level in 35 Years

Against the backdrop of a seven-month ongoing war that has repeatedly threatened the world’s most important oil passage, the crude oil options market is sending an unusual signal—its pricing logic is no longer centered on supply shocks, but rather on the pain in the bond market.
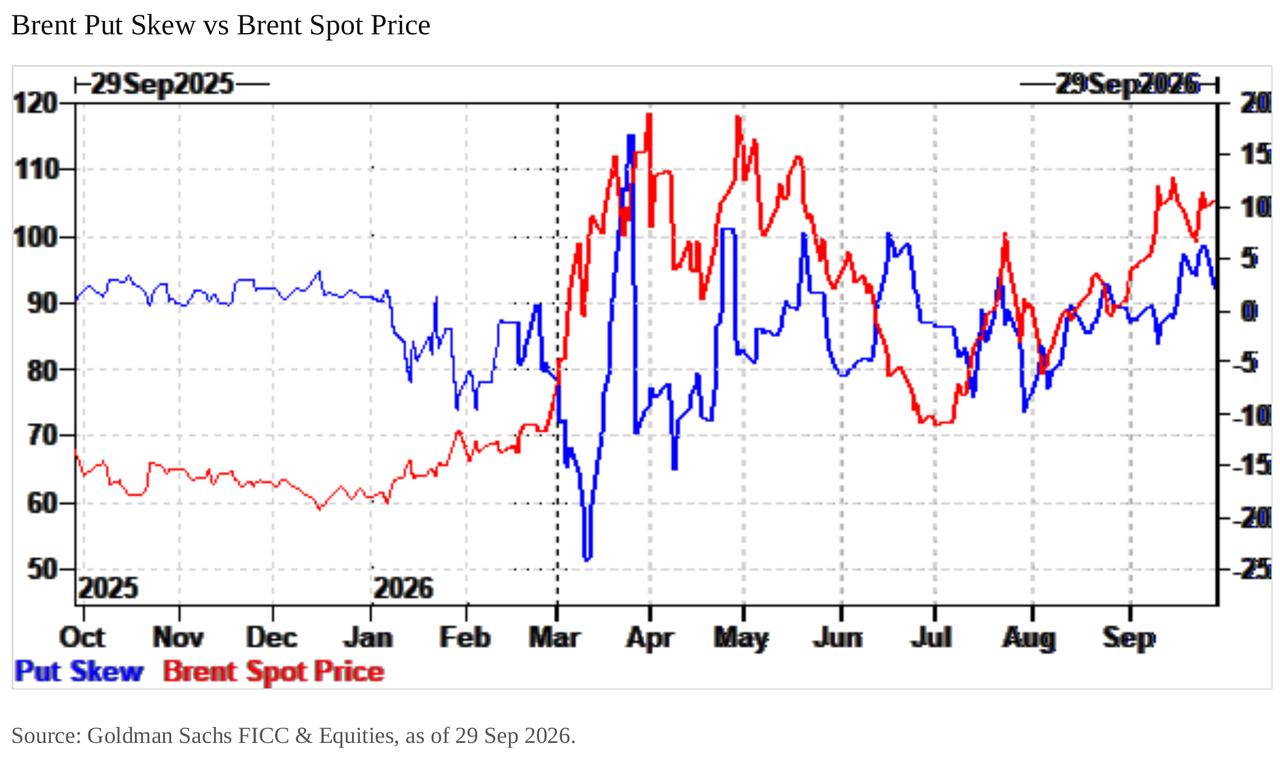
According to the latest report by Isabel Blaze, an analyst with Goldman Sachs FICC and Equity Commodities team, a clear "dislocation" has appeared in the Brent crude oil options market: put option skew has surged sharply, while call option skew has fallen below pre-war levels, resulting in a severe divergence in the pricing of both sides.
Meanwhile, another Goldman Sachs trader pointed out that the correlation between WTI crude oil and the 10-year US Treasury yield has risen to its highest level in 35 years, while the correlation between equities and yields has dropped to the most negative level since 1960. This linkage is reshaping the framework through which the market understands oil price trends.
The direct implication of this structural shift for the market is that upside risks in crude oil are hardly being hedged, while macro portfolios’ exposure to interest rate volatility is implicitly being transmitted through crude oil positions. Once geopolitical tensions escalate again, oil prices and the bond market will deliver a double shock, especially given that the current 10-year US Treasury yield is already at a high of 5.32% and the MOVE index has rebounded to levels seen at the onset of the war.
Both wings should be bought, but only one is being bid for
In the physical market, supply tightness has eased significantly from the early September peak. According to Goldman Sachs, more tankers are passing through the Strait of Hormuz, East-West pipelines have been restored to pre-attack capacity, Yanbu export flows are back online, and the market is entering a seasonally low demand period. These factors should, in theory, push prices downward and result in a balanced volatility surface.
However, the options market reveals a different story. Goldman Sachs data shows Brent put option skew has climbed back to its summer highs, while the 25-delta risk reversal metric has slid back to nearly zero (as of September 29, it was 0.012), essentially the same as the calm pre-war period in fall 2025. In other words, there is a war premium in at-the-money pricing, but call option pricing has returned to pre-war levels—an obvious contradiction between the two.
The driver is not fundamentals, but the bond market
Financial investors are seeking directional exposure in crude oil, driven not by concerns over supply shocks, but by portfolio losses caused by interest rate volatility.
Goldman Sachs writes in the report: “Our judgement is that this inflow is a result of portfolio pain triggered by interest rate volatility. Many macro portfolios are structured to perform well in times of eased crises, but would suffer heavy losses if oil soars to $130, thus effectively being short crude oil in tail scenarios. Recent intense swings in rates have transmitted this pain to directional oil buying, whether through short covering or fresh protective purchases, making price moves more closely tied to interest rates.”
This logic can be simplified as: a typical macro account is long bonds, betting on peace, while implicitly shorting the $130 oil price tail risk. When yields spike sharply, stop-loss trades mean buying crude oil. A Goldman Sachs chart shows that since July, Brent crude oil has moved almost in sync with the 10-year Treasury yield.
The “mini-rate shock” on September 23 pushed this feedback loop to the extreme. According to a report by Bank of America credit strategists, the 5-year US Treasury yield soared 17 basis points in one day, the biggest single-day jump in nearly two years, while Brent crude rallied 4% in the same period. This happened just a week after Fed Chair Warsh announced the first rate hike since July 2023, with yields hitting multi-decade highs the following day.
A breach in correlation, but macro positions remain intact
It’s worth noting that since September 18, WTI crude oil has fallen around 9% from about $100 to $90.80, while the 10-year Treasury yield has climbed from about 5.00% to 5.32%, breaking the synchronized pattern that had persisted since late August.
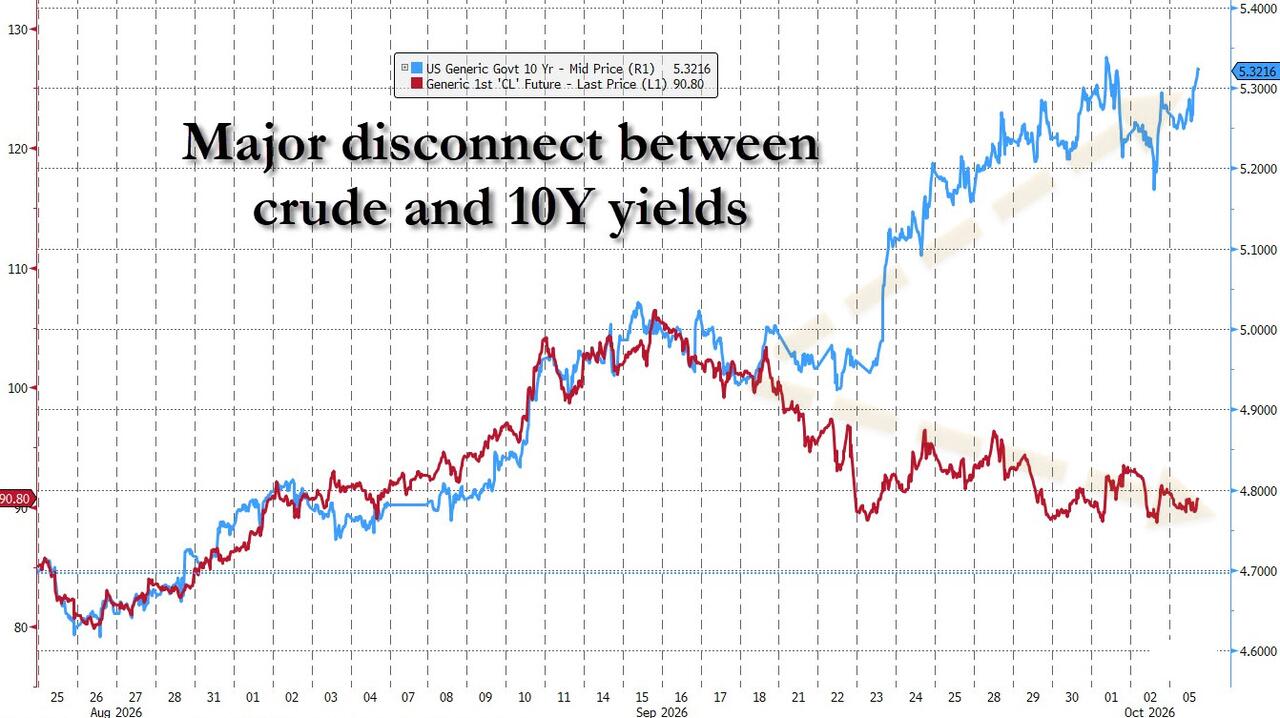
This divergence may superficially seem to shake Goldman Sachs’ thesis, but in reality, it does not. Goldman points out that the high correlation built up from August to mid-September remains the basis for the record linkage, and that macro funds that bought oil to hedge rate pain are still holding their positions. The change: further rate increases no longer require cooperation from oil prices.
Bank of America’s rates team, including Mark Cabana, observed the same breach in their "Global Rates Weekly," noting that “the correlation between rate volatility and commodities has weakened as broader market influences are growing,” citing the widening spreads in French government bonds, peripheral Eurozone bonds, and US high-yield bonds. In other words, the bond market has been elevated from a support role in oil to the lead role.
Dealers are short puts, volatility falls asleep
The third distortion comes from the market structure itself. Goldman Sachs notes that despite oil prices remaining high, implied volatility is weak and skews have largely reverted.
The report reads: “Put options are becoming more expensive, call options are becoming cheaper, and both have fallen below pre-war levels. There’s almost no demand for upside volatility in the market. The only genuine flow is extraordinarily large put option buying, structurally positioning dealers short puts against what seems to be concentrated macro directionality. This structural short forms a negative vanna effect—when the market rises, dealers’ short positions shrink and implied volatility falls; when the market drops, dealers’ short exposure increases and implied vol rises. The net effect is that, despite the ongoing geopolitical crisis, the market has reverted to a negative spot-volatility correlation dynamic.”
In short, crude oil is now traded in the same way as the S&P 500 Index: volatility rises when the price falls and is suppressed when the price rises. This is the opposite of what would be expected in a supply shock market. Goldman Sachs data show that at-the-money implied volatility is now in the low 50s, only about one-third of its mid-March peak of 150, while Brent oil prices remain near their spring highs.
Oil volatility becomes the new "Sleeping VIX"
The key judgment of Goldman’s second trader: oil volatility is playing the role of a sleeping VIX, while the MOVE index is exploding upwards, making crude oil upside an unpriced tail risk.
According to Bank of America data, the MOVE index rose to 100 in September, its highest since the Iran war broke out in March, and the 1-month x 10-year implied interest rate volatility jumped to a six-month high after the September 23 rate shock.
This is crucial for the oil market: if, as Goldman says, macro accounts are structurally short the $130 oil price tail risk and their pain trigger is interest rates rather than oil tankers, then any renewed escalation could mean a double blow—an oil price shock coupled with bond market selloffs. And at present, no one is paying for this kind of protection.
Disclaimer: The content of this article solely reflects the author's opinion and does not represent the platform in any capacity. This article is not intended to serve as a reference for making investment decisions.
You may also like
SUI holds above $1.045 support as Basecamp 2026 drives market focus
Gold hits two-month low as bears await break below $4,100 amid sustained USD strength
Inflation and Employment Projections: US Neutral Interest Rate May Remain Elevated

Crypto prices
More


