The setup developed after $ADA topped around $0.265-$0.266 on Sept. 26. Subsequent rallies produced lower highs, while the lows also drifted lower, leaving price inside two descending trendlines.
That structure remained intact through early October. $ADA then based around the $0.243-$0.245 region before buyers pushed price back through $0.25 and toward the upper trendline.
$ADA Breakout Now Faces Its First Confirmation Test
The breakout attempt occurred around the $0.258-$0.260 area, where the descending resistance line crossed current price action.
$ADA has now moved above that zone, but the next few four-hour candles matter. Holding above the former resistance would turn that line into potential support and strengthen the breakout structure.
The first nearby hurdle is the cluster of recent wick highs around $0.267-$0.269. Price is already testing that area. A clean move through those highs would leave $0.275 as the next visible level on the chart.
From the chart’s $0.264 reference, a move to $0.275 would amount to roughly 4.2%.
Former Resistance Becomes the Main Support to Watch
If $ADA pulls back, the first test sits around $0.258-$0.260, where the old descending resistance now runs.
Holding that zone would keep the breakout intact. A drop back beneath it would put price inside the previous structure again and weaken the bullish case.
Below that, the recent consolidation around $0.250-$0.253 becomes the next area to watch. A deeper reversal toward $0.245 would erase much of the latest breakout push.
For now, $ADA has done the first part by moving above the falling resistance line. The next technical test is whether buyers can defend $0.258-$0.260 on any retest and then clear the recent highs near $0.269.


 thecryptobasic.com
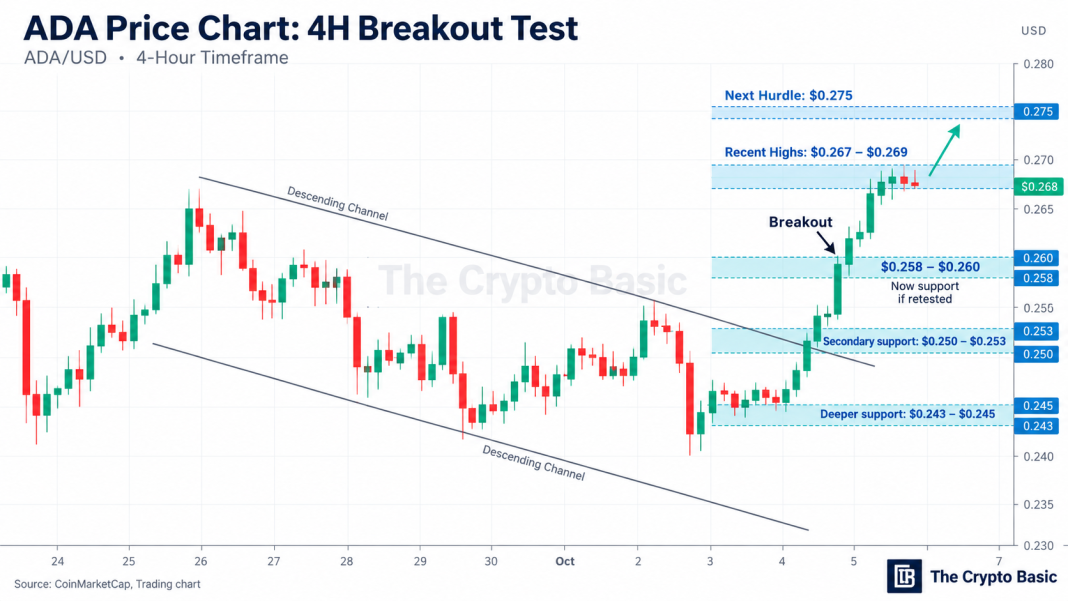 $ADA’s four-hour chart shows price breaking above a descending resistance line after recovering from the $0.243-$0.245 area. The former resistance around $0.258-$0.260 is now the first support to watch, while recent highs near $0.269 remain the next hurdle.