The first warning appeared around $5.40-$5.60. $NEAR repeatedly produced long candle wicks and large intraday reversals in this region, showing that sellers were willing to distribute into strength. Instead of continuing to print consistently higher highs and higher lows, the price has subsequently moved sideways around $4.60-$5.00.
Momentum indicators confirm this cooling. The daily RSI pushed above the traditional 70 overbought threshold during the rally but has now retreated toward the low-60 area. This is not outright bearish: RSI remains above 50, but the loss of overbought momentum confirms that the exceptionally strong acceleration phase has ended.
Trading activity stabilizes
Trading activity exploded during the breakout from roughly $2.50 through $4.50, while recent consolidation has occurred on substantially lower volume. Buyers therefore have not yet demonstrated enough conviction for another immediate vertical leg.
The important support zone now sits around $4.60-$4.70. Holding it would allow $NEAR to establish a higher base before attempting another move toward $5.00 and ultimately the $5.40-$5.60 resistance area. A clean breakout above the recent peak would restore the ultra-bullish structure.
Losing $4.60, however, would substantially increase the probability of a deeper correction. The rapidly rising short-term moving average is approaching the $4.00-$4.10 region, making it the next major dynamic support.
For now, $NEAR has broken its ultra-bullish trajectory, not its broader bullish trend. After such an extreme rally, consolidation is structurally healthier than another near-vertical advance. The key question is whether buyers can defend $4.60 and turn the current pause into a continuation pattern.


 u.today
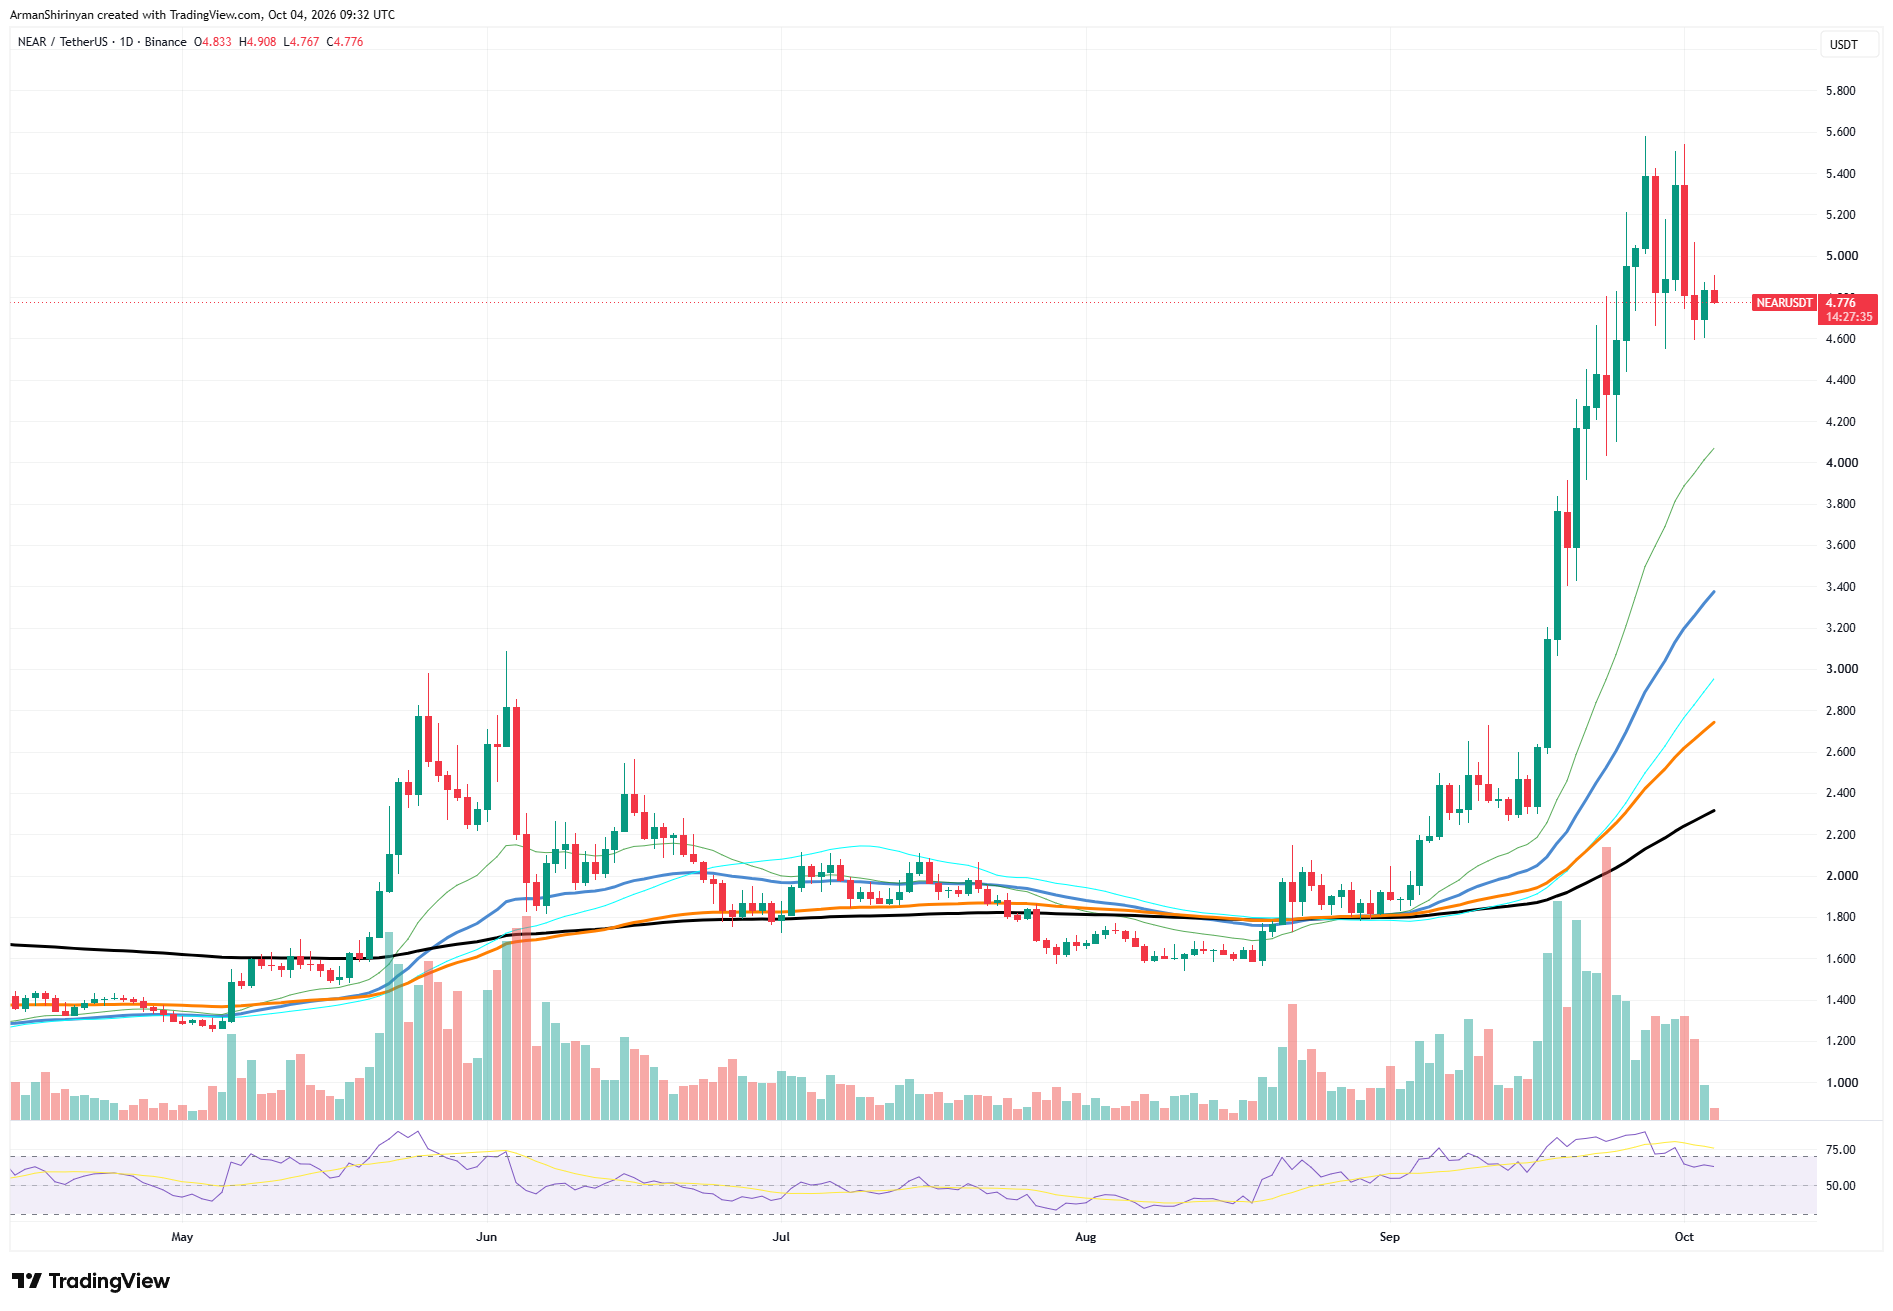 $NEAR/USDT Chart by TradingView


