
Gold Outlook: Spot Gold Faces Significant Rebound Risk After Sharp Decline

Huitong Network, September 29—— Gold previously plummeted under pressure from solid fundamental factors, but historical trends suggest that an extremely oversold condition on the four-hour chart may trigger a sharp counter-trend rebound.
This week’s opening saw a brutal sell-off in the precious metals market, with all types of precious metals experiencing significant drops, ranking among the largest declines in history.
Gold fell by more than 4%, silver by more than 5%, and platinum and palladium dropped close to 3.5% and 5%, respectively. For gold, this was the 88th largest single-day drop since statistics began in 1968, with declines in other precious metals also closely following.
As previously mentioned, the current macro environment is extremely unfavorable for precious metals: precious metals themselves do not generate interest income, physical holding incurs storage costs, and they are mainly priced in U.S. dollars.
The performance of U.S. real yields confirms this point. Although in the short term, there is no strong correlation between real yields and gold, when observed over a longer timeframe, their divergence is very apparent.
The U.S. 10-year real yield, which represents the return investors can obtain after deducting the market's average inflation expectations over the next ten years, has now surged to 2.85%, the highest since November 2008, and the 22nd highest single-day close since 2003. The pace of this rise has also been extremely rapid: over the past 20 trading days, real yields climbed another 51 basis points from already historic highs.
Even though the signal from U.S. Treasury Inflation-Protected Securities (TIPS) may be distorted by lingering effects of previous Federal Reserve quantitative easing, it is difficult to reach a bullish fundamental conclusion for precious metals (or broadly defined risk assets) in the face of such high risk-free real yields.
For gold, the issue is very straightforward: when investors can earn nearly 3% real yield from U.S. Treasuries, how can gold—as a traditional safe haven asset, which bears no interest income and is priced in U.S. dollars—compete with that?
With this understanding, it’s not hard to see why gold is currently struggling in the present environment.
Gold has faced strong selling pressure, supported by solid fundamental logic. But while macro fundamentals are one thing, price action entering an extremely oversold state is another.
So far, there hasn’t been a catalyst to ease the downward pressure on the precious metals market, but historical experience suggests a sharp counter-trend rebound is not out of the question.
On gold’s four-hour chart, the 14-period Relative Strength Index (RSI) has reached an extreme oversold reading, and the ATR-50 stretch indicator is also in an extreme zone, with the latest closing price below the lower Bollinger Band.
Reviewing historical charts reveals that after similar technical setups appeared in the past, gold prices often saw sizable rebounds.
To avoid relying solely on subjective visual judgment, this article reviews historical data and backtests past performances after similar oversold conditions.
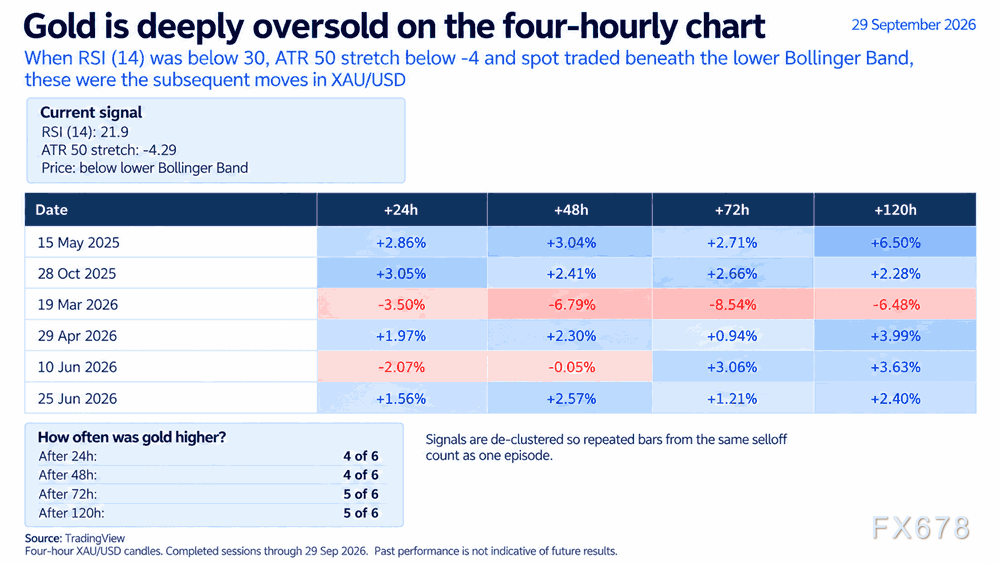
The backtest used fixed and simple criteria: on the four-hour chart, the 14-period RSI was below 30, the ATR-50 stretch indicator was below -4, and gold traded below the lower Bollinger Band.
According to these criteria, there have been a total of 6 separate occurrences of similar events in history.
Out of these 6, gold prices rose 4 times within 24 hours; and also 4 times within 48 hours;
By 72 and 120 hours, gold climbed in 5 out of 6 cases.
The only obvious exception occurred in March this year: at that time, selling pressure continued, and prices kept falling. Every round of massive sell-off has its unique backdrop, and that episode was very special: previously, gold had seen an extremely frenzied speculative run in the modern market, reaching as high as $5,500/oz before breaking down and starting to fall.
This case also warns us that historical patterns do not always repeat so simply. But overall, there is still a chance for gold to stage a short-term rebound, even within the context of a larger downtrend.
$4,115 becomes the first pivotal line between bulls and bears
Monday’s slump was very fierce, breaking through several support levels, and gold is currently struggling just above the $4,115/oz support.
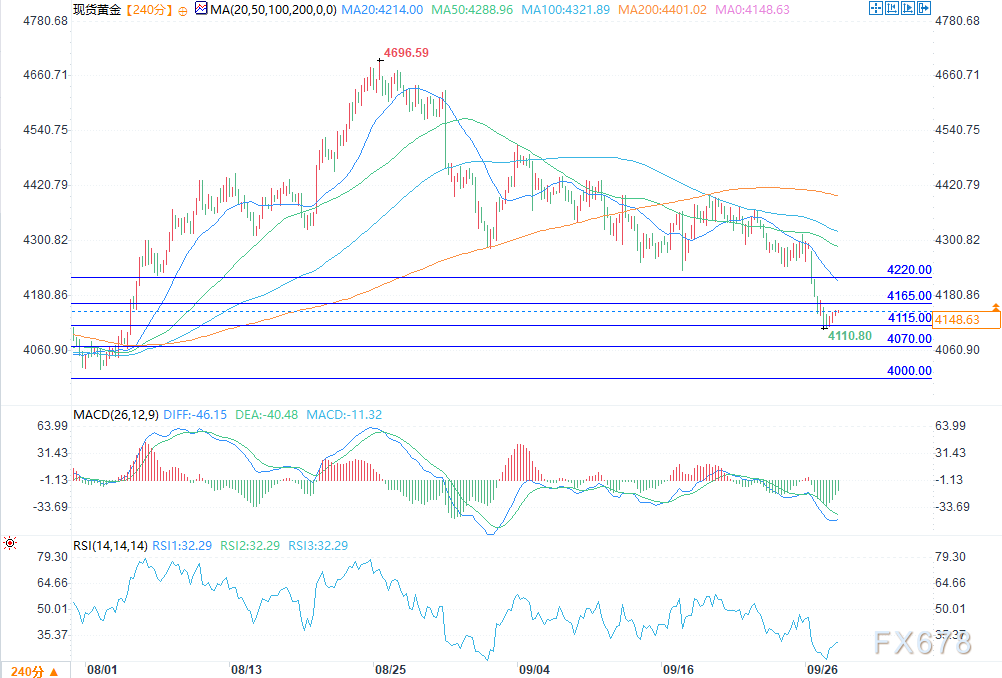
(Spot gold 4-hour chart Source: Easy Huitong)
This price is now the key level that gold traders are watching.
If the downward trend continues, the next critical target will be $4,070/oz—a level that acted as both resistance and support from late July to early August this year;
Below that, there is a stronger support zone under $4,000/oz: the late July stage low at $3,996 is the upper end of the zone, while $3,943, this year’s earlier low, marks the lower end.
On the flip side, if gold starts a counter-trend rebound from $4,115, it could first challenge the late July stage high at $4,165, with the next key resistance at $4,220.
For any rebound to firmly establish above $4,220, significant macro news would probably be needed, at least partially offsetting the downward pressure on precious metals from rising U.S. Treasury yields and a strengthening U.S. dollar.
Disclaimer: The content of this article solely reflects the author's opinion and does not represent the platform in any capacity. This article is not intended to serve as a reference for making investment decisions.
You may also like
MoonPay launches Seoul hub for KRW stablecoin push with Woori Bank
Hedera Micropayments Expand Digital Payments
Altcoin Selection Covers Key Crypto Sectors
Crypto prices
More


