
Glassnode Market Compass: US dollar returns to the 200-day moving average, comprehensive index drops to the defensive zone at 23

Author: Glassnode
Translation: TechFlow
TechFlow Summary: Glassnode's latest Market Compass overall score dropped another 3 points to 23/100, entering the defensive zone; the macro score fell 8 points in a single week to 31, with the US Dollar Index returning to the 200-day moving average, effectively erasing three weeks of macro recovery in one night. On-chain fundamentals instead rose to 52, the best reading of this cycle, but the broad-based asset rally at the end of August has faded, and profit-taking during Bitcoin's rebound has been aggressive.
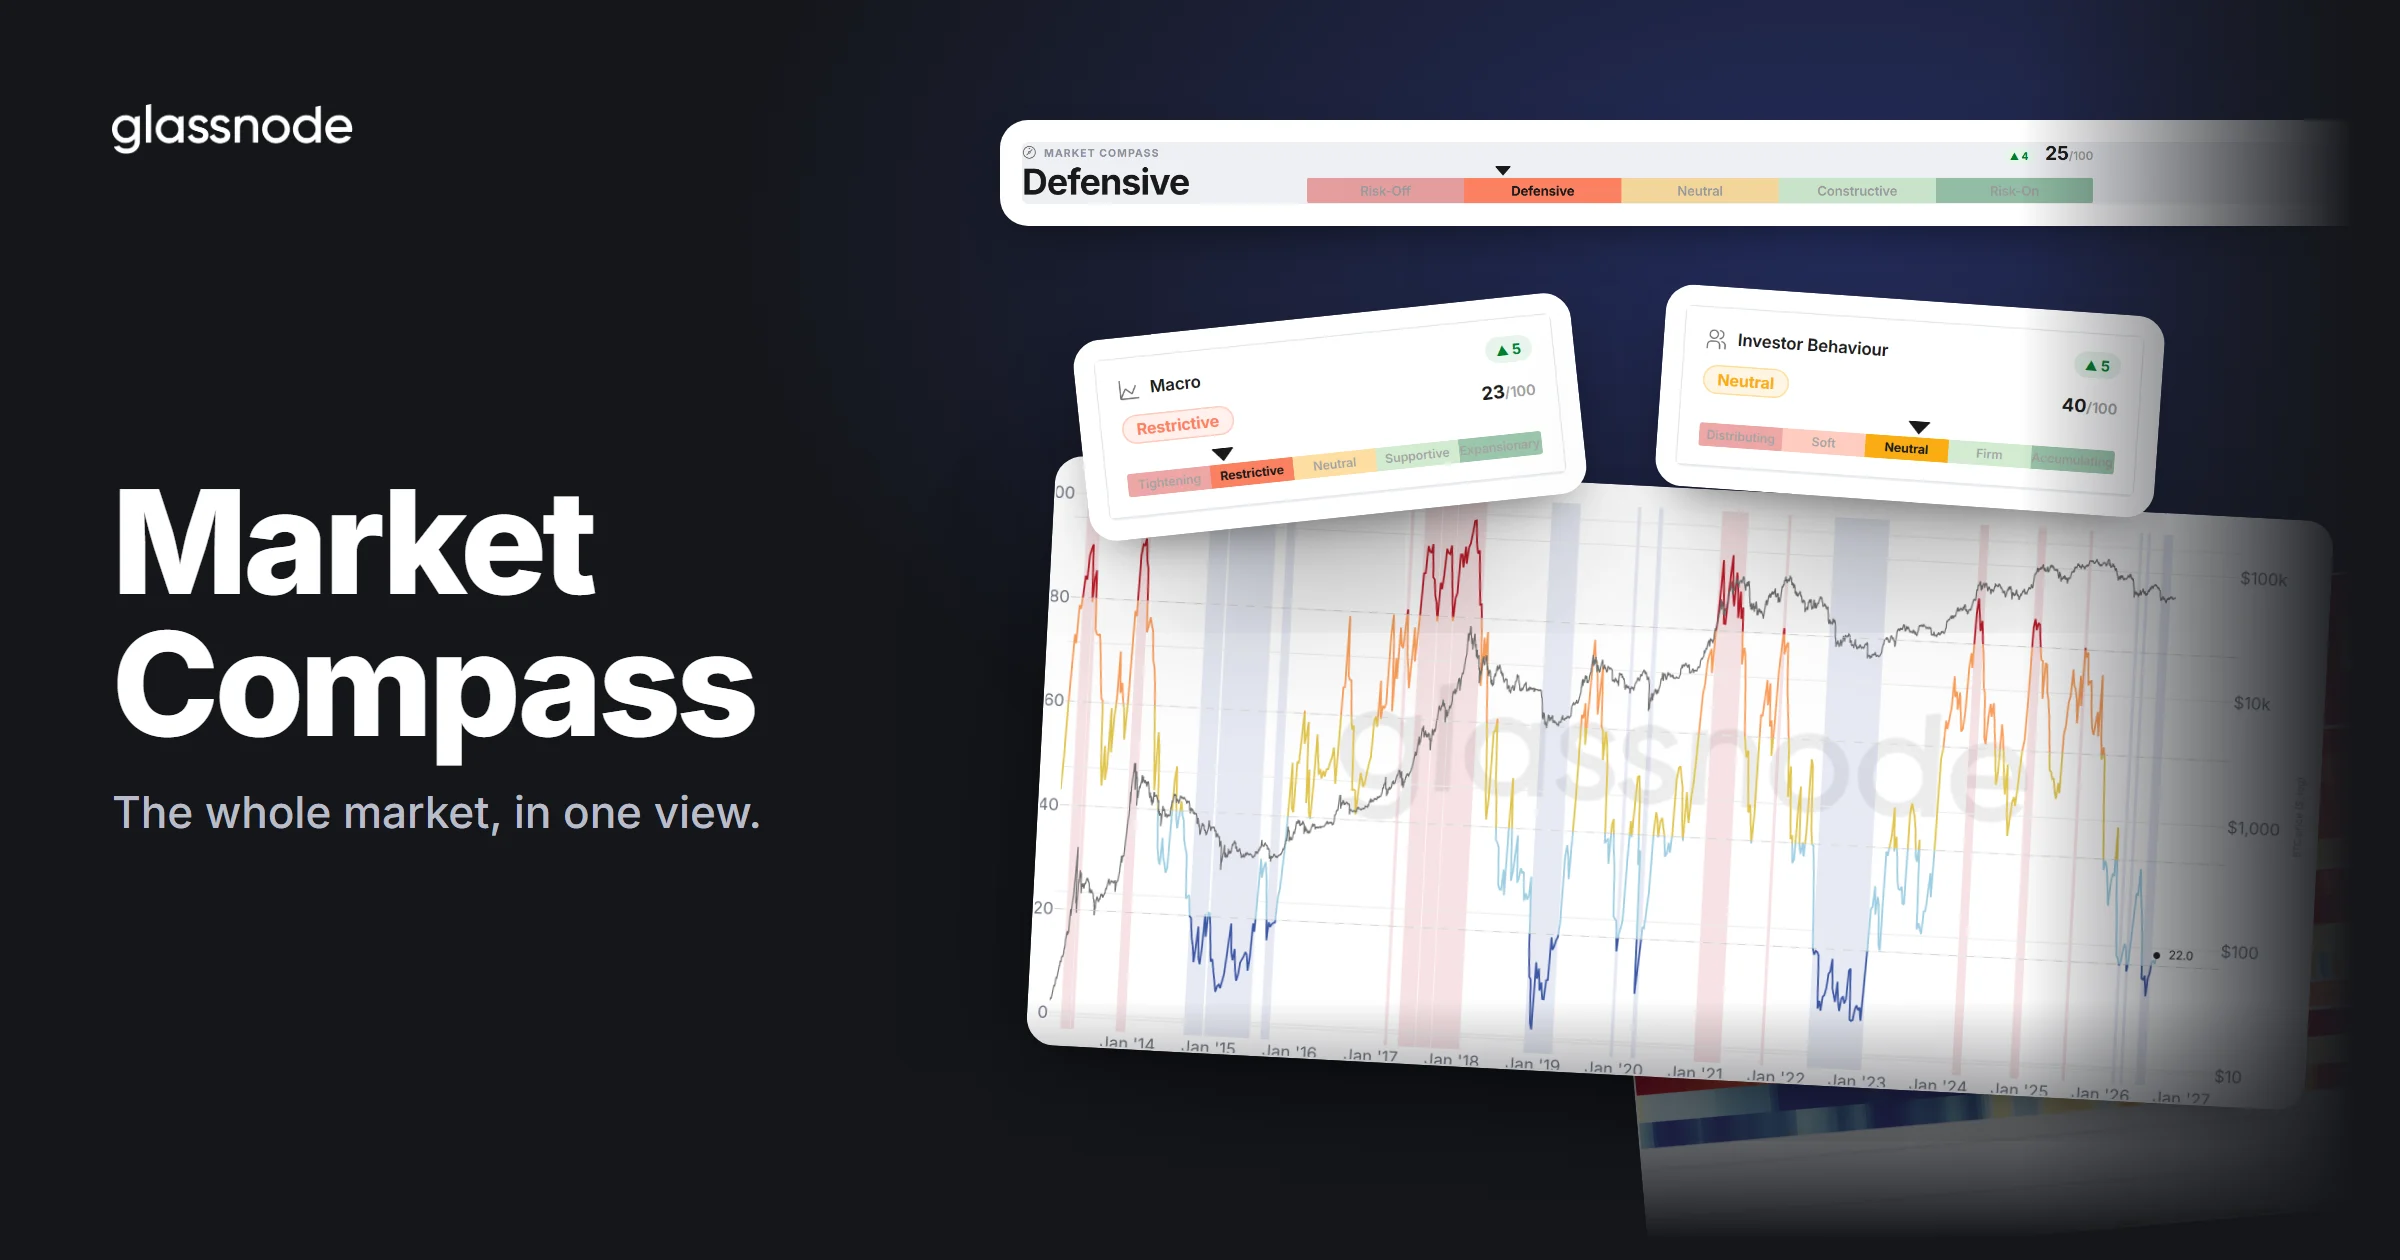
The overall score fell another 3 points to 23/100 (defensive), 2 points lower than a week ago and 5 points lower than a month ago. The macro score dropped by 8 points in a week to 31/100, and with the US Dollar Index returning near the 200-day moving average, it has slipped back to the "tightening" side—three weeks of macro recovery were undone in a single trading day. On-chain fundamentals climbed to 52, the best reading of this cycle; capital flows, cycle position, and investor behavior have remained almost unchanged. It is one single lens in motion, yet it has driven the entire market.
Beneath the title, two charts underpin this week's story: just how "broad-based" the market was at the end of August, and who sold off during the rebound.
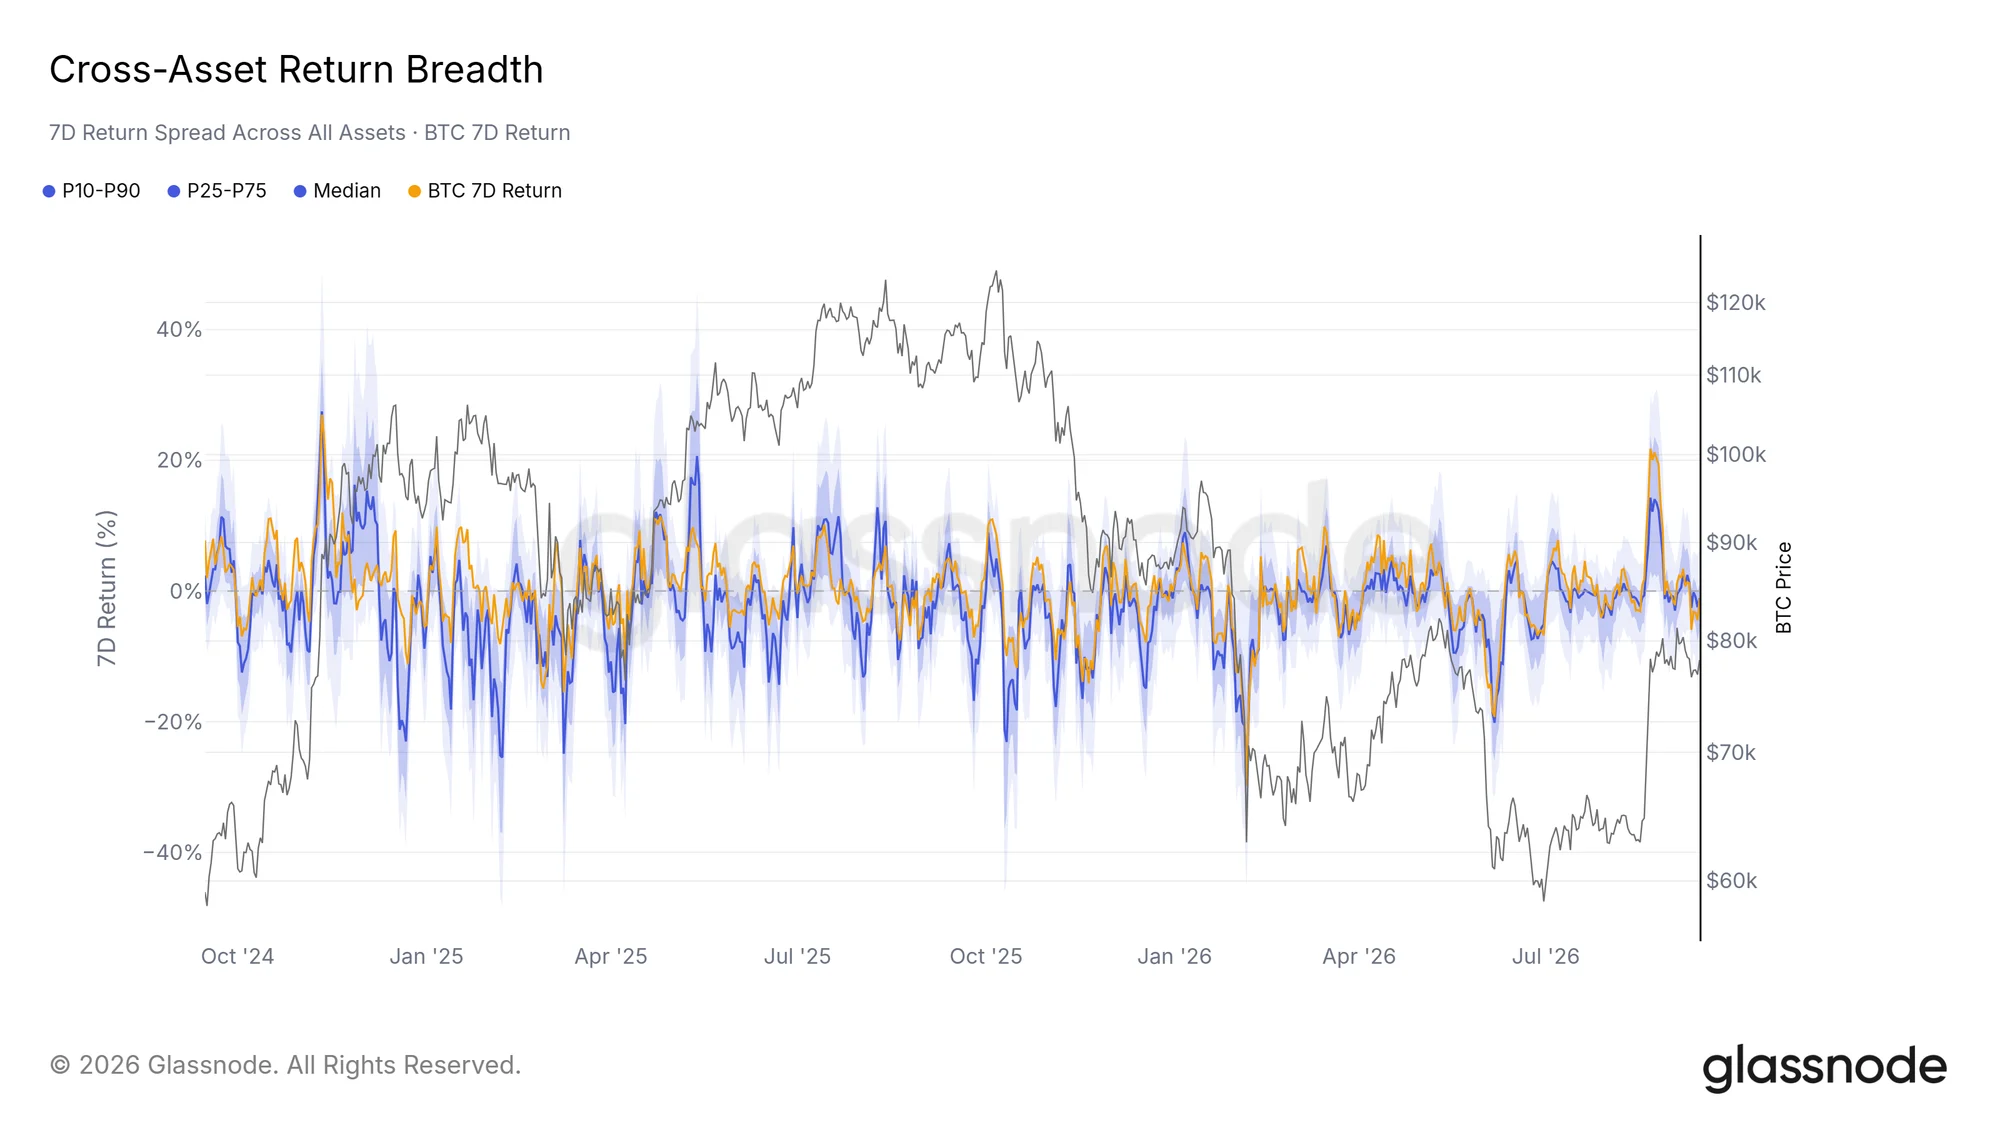
At the end of August, almost all assets surged together, marking the largest cross-asset synchronous rally of the year: the Altcoin Season Index returned to 75, with mid-cap coins leading the 30-day rankings. This kind of broad-based, simultaneous rally has historically resembled a risk zone rather than the start of a sustainable uptrend. The outbreak has faded: the median seven-day return across all asset classes has returned to nearly zero, and the index briefly crossed—then lost—the boundary for altcoin season.
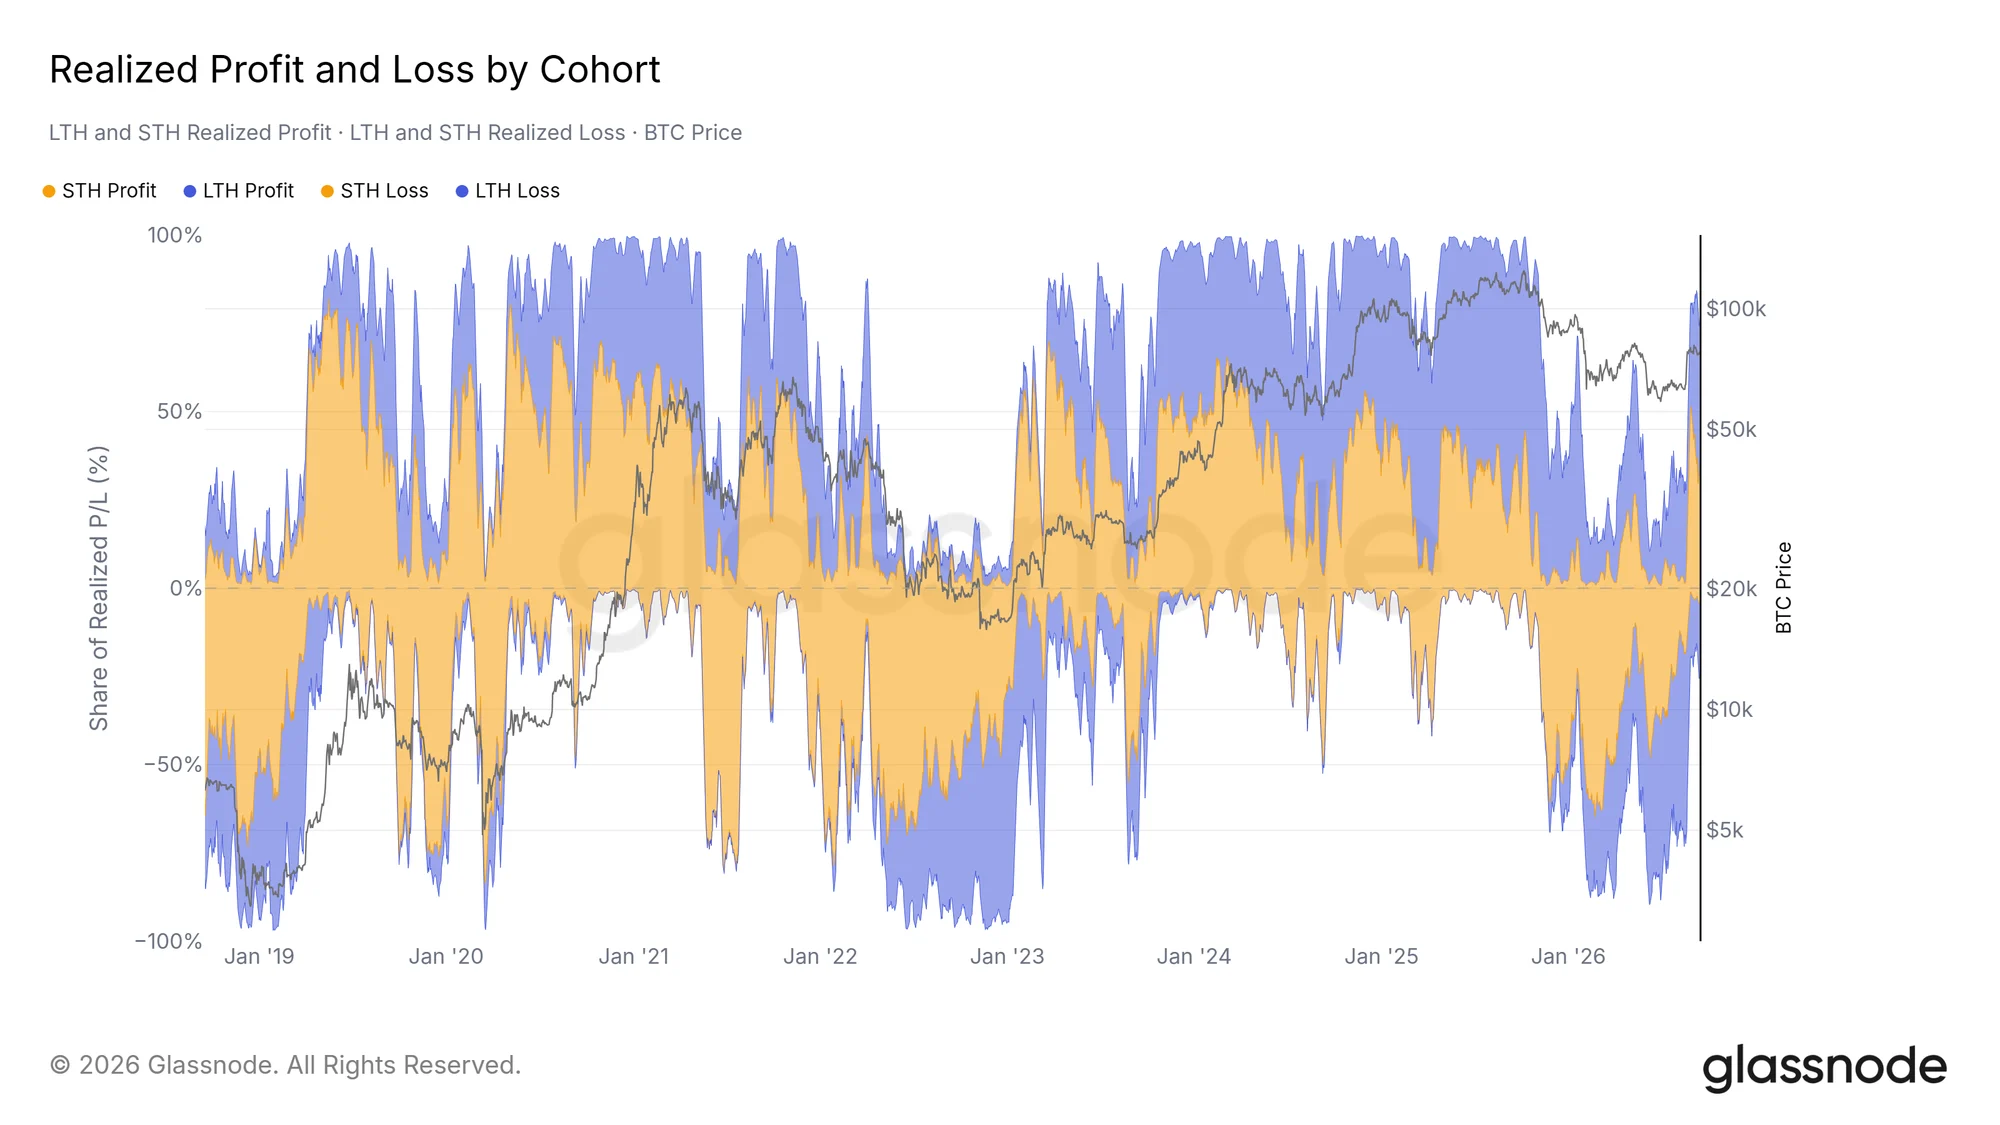
Bitcoin rebounded to a premium of about 47% over its realized price, but holders took the opportunity to sell into the rally. In the past three weeks, realized capital flows shifted from mostly loss-taking to mostly profit-taking, with long-term and short-term holders roughly even, and losing flows shrinking to just a small portion. The realized PnL ratio hit a new high for this cycle at 2.63. Such one-sided profit-taking is common in the charts of the 2024 and 2025 bull phases; the kind of retracement expected through the cycle lens has not yet begun.
What could reverse the trend: if the US Dollar closes firmly above the 200-day moving average, it would confirm the macro reversal and drag the overall score further down; if investor behavior finally turns upward, it may hedge this move.
Disclaimer: The content of this article solely reflects the author's opinion and does not represent the platform in any capacity. This article is not intended to serve as a reference for making investment decisions.
You may also like
NFI Group's New Flyer to Supply Heavy-Duty Transit Buses to Central Ohio Transit Authority
RTX's Pratt & Whitney Completes F135 Engine Core Upgrade Risk Reduction Design Review
10-Yr Benchmark Govt Yields - Germany vs Other Nations
10-Yr Benchmark Govt Yields - U.S. vs Other Nations
Crypto prices
More


