Recently, the market's attention has been focused on US inflation data and Federal Reserve policy expectations. After the CPI data was released, market disagreements between bulls and bears rapidly intensified, leading to increased short-term shakeout movements. Fluctuating inflation data repeatedly impacted US Treasury yields and the US dollar trend. The crypto market reacted violently to macro news, with major players using this data window to repeatedly shake out retail investors. Although short-term volatility is significant, the overall mid- to long-term bullish structure has not experienced any substantial damage, and the market remains in a high-level consolidation and accumulation phase.
Looking back at last Friday's overall price action, the trend was truly full of twists and turns. After the CPI data was announced, the price first dipped sharply, then staged a V-shaped reversal and rally, followed by another sharp decline forming an inverted V pattern later at night—a textbook deep shakeout. Throughout last week, the main trading strategy was to focus on longs with shorts as a supplement, successfully capturing profits in both directions. BTC shorts were deployed in the 79,500‑80,000 resistance area, and after dropping to the 77,000 support area, longs were re-entered, realizing profits from high-selling and low-buying. For ETH, shorts were opened at the 2,510 high, switched to longs after dropping to the 2,420 low, with solid profits from both directions.
From the weekly indicators, although BTC closed with a bearish weekly candle, the MACD still maintains a golden cross and is moving upward, indicating bullish momentum has not significantly weakened. The RSI indicator has turned upward, suggesting a solid bullish trend foundation. On the daily chart, after a prolonged period of Bollinger Bands narrowing, the bands are gradually flattening out and the consolidation range continues to tighten. KDJ and RSI are both turning upwards, while MACD bearish momentum continues to decrease—signs of stabilizing technicals and a potential rebound.
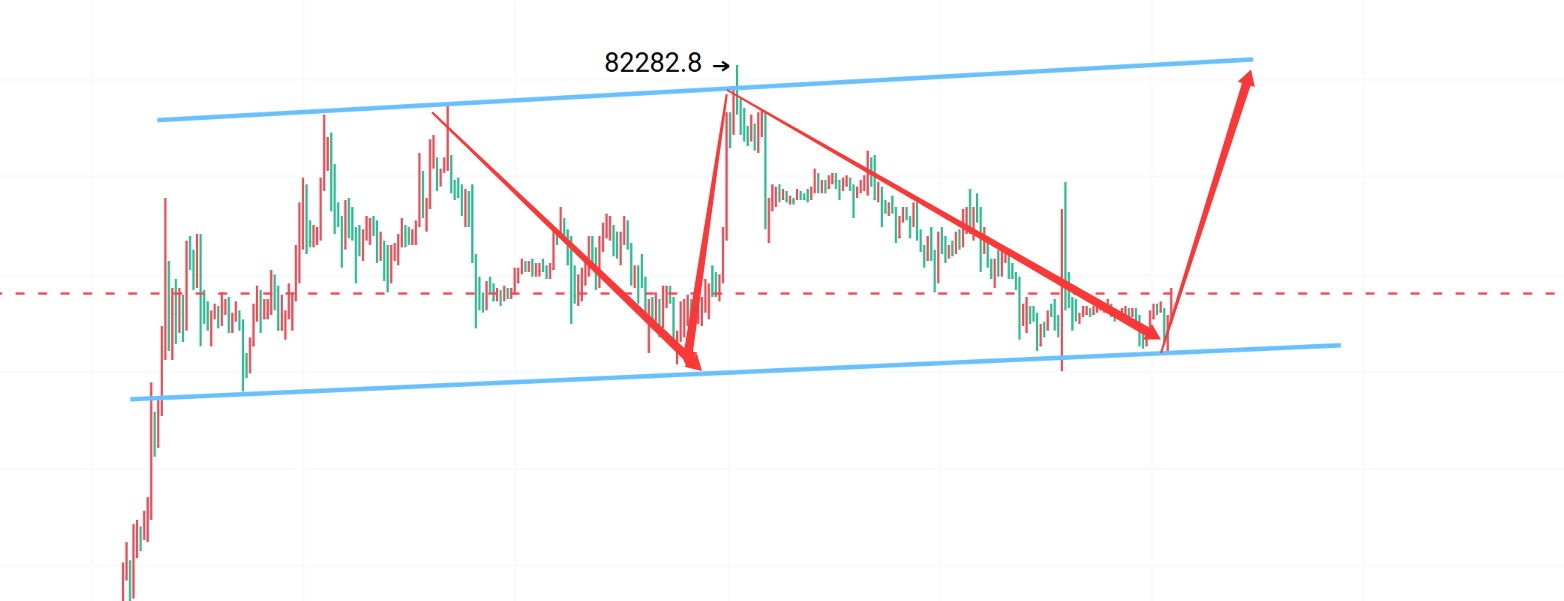
My view remains unchanged: as long as the price does not effectively break below the key 75,000 support, the overall bullish structure remains intact. The market has repeatedly dipped lower recently, but every drop quickly recovers, with prices oscillating at high levels. This is a classic pattern where consolidation substitutes for price drops, with major players absorbing floating chips within the consolidation range, waiting for volume to eventually choose a new direction.
Last Friday at midnight, I suggested taking long positions in the 77,000‑76,000 support zone. The market pulled back to as low as 76,300 before immediately rebounding. These long positions can continue to be held and are already in profit. For investors currently without positions, this support area is still valid and can be used to seek long positions on dips; resistance levels to watch are 78,000, 79,000, and 80,000.
For ETH, I recommended a low long strategy in the 2,500‑2,450 support zone. The market pulled back to a low of 2,460, providing an ideal entry point. Existing long positions can continue to be held; resistance levels are at 2,530, 2,600, and 2,660. For those not yet in, it’s still possible to set up long positions near support.
In a consolidating market, avoid chasing highs or panic selling the dips. Do not blindly go long after big rallies or panic sell after sharp drops. Wait patiently for price to pull back to key support before positioning with the trend, seize reasonable entry points, follow strict risk management, and maintain a steady mindset to ensure solid profits amid repeated market fluctuations.