
Archer Aviation Stock Stays Below Every Key Average Despite Wisk Aero Deal

Archer Aviation stock sits at an uncomfortable crossroads. The daily chart shows the stock struggling under its moving averages, even as newsflow keeps improving. The gap between narrative and price action is the real story right now.
Summary
Key takeaways
- ACHR closed at $5.50, trading below all three daily EMAs (20, 50, 200).
- Daily RSI14 reads 44.87 — neutral territory, not yet signaling exhaustion.
- The MACD histogram at -0.08 confirms a bearish cross and fading momentum.
- Positive fundamentals — including the Wisk Aero acquisition and Midnight eVTOL milestones — have yet to lift price action.
- Daily support sits at $5.40; a break below opens the door to the lower Bollinger band at $5.29.
Archer Aviation Stock: Daily Trend Still Leans Bearish
The daily chart for Archer Aviation stock remains in a clear bearish structure. Price trades below all three key EMAs, with the 200-day sitting more than a dollar above spot.
The EMA20 sits at $5.79, the EMA50 at $5.68, and the EMA200 at $6.52. That stacking — price under every average — points to a stock still working through a longer-term downtrend. This is not a fresh breakout.
At the same time, RSI14 on the daily reads 44.87, neutral territory rather than oversold. The recent slide has not reached exhaustion. No strong technical signal suggests the downside is done.
Meanwhile, the daily MACD line reads 0.01 against a signal line of 0.10. The histogram sits at -0.08. That bearish cross confirms momentum is fading rather than building.
The Bollinger setup adds another layer. The mid-band sits at $6.04, the upper band at $6.79, and the lower band at $5.29. At $5.50, ACHR trades in the lower half of its volatility envelope, closer to the floor than the middle.
ATR14 of $0.28 shows daily ranges remain wide relative to the share price. Swings in either direction stay very plausible.
Pivot levels reinforce the cautious read. The daily pivot is $5.60, with resistance at $5.69 and support at $5.40. Price closing below the pivot keeps the near-term bias tilted to the downside unless buyers step in with conviction.
Hourly Chart Confirms the Weakness
Meanwhile, the hourly timeframe offers no relief for Archer Aviation stock. Price sits below all three EMAs, and the EMA50 and EMA200 have converged almost exactly. That convergence signals a stalled intraday trend rather than fresh strength.
The latest hourly candle closed at $5.50, with EMA20 at $5.67, EMA50 at $5.73, and EMA200 at $5.73. Notably, the EMA50 and EMA200 sitting at the same level reinforces the stalled-trend read.
RSI14 on the hourly has dropped to 33.91, approaching oversold conditions. MACD is negative too. The line at -0.04 against a signal of -0.01 produces a histogram of -0.03.
In short, the hourly chart is confirming, not contradicting, the daily bearish tilt. That alignment across timeframes strengthens the case that current pressure is more than daily noise.
The hourly Bollinger bands show the mid at $5.69, upper at $5.90, and lower at $5.49. Price remains essentially glued to the lower band. Pivot data puts the hourly pivot at $5.53 and S1 support at $5.47, meaning ACHR trades right on its intraday floor.
15-Minute Chart: Oversold, But Not Reversing Yet
Zooming in further, the 15-minute chart shows Archer Aviation stock in oversold territory. However, a confirmed reversal has not yet materialized. RSI14 has fallen to 31.46, while the MACD histogram has merely flattened rather than turning positive.
The system explicitly tags the 15-minute regime as bearish. The MACD histogram flattened to 0.00, even though both the MACD line and signal remain negative at -0.04. That flattening can hint at short-term seller fatigue. It is not yet a confirmed reversal signal.
Additionally, price hugs the lower Bollinger band, with the mid at $5.59, upper at $5.65, and lower at $5.52. The 15-minute pivot sits at $5.52, with support at $5.48. Both levels sit essentially where price currently trades.
Still, for traders watching intraday entries, the support cluster around $5.47–$5.48 is the level to monitor. Any short-term bounce attempt would need to start there.
A Real Conflict: Strong News, Weak Price Action
Archer Aviation stock presents a genuine conflict between fundamentals and price action. The operational news has been constructive, yet the technical picture remains decidedly weak.
On the fundamental side, Archer Aviation has been anything but quiet. The company is reportedly buying Boeing’s Wisk Aero, Insitu, and SkyGrid. This signals rapid expansion through partnerships and acquisitions.
Separately, Archer’s Midnight eVTOL completed a piloted round trip between Salinas and Hollister airports. The flight covered roughly 40 miles in 12 minutes each way, backed by FAA-supported expansion plans.
Beyond that, Archer’s multi-city “No Roads” flight tour is expanding Midnight testing across varied routes. The company is preparing for eIPP flights, LA28, and eventual passenger services.
Even Motley Fool’s coverage framed shares below $6 as a risk-tolerant buy opportunity, while making clear the stock remains far from safe.
Therefore, the disconnect is notable. The operational and corporate news is genuinely positive. Yet price still trades below every meaningful moving average on both daily and hourly charts.
This divergence often means the market has not fully digested the news. Alternatively, broader sentiment may simply be overriding company-specific catalysts for now.
Bullish Scenario
For Archer Aviation stock to turn bullish, buyers must reclaim key technical levels. The first hurdle is the daily pivot at $5.60, followed by the EMA50 at $5.68.
A close back above the EMA20 near $5.79 would be a stronger signal. That would indicate short-term structure is repairing. RSI moving back above 50 on both daily and hourly charts would confirm momentum has actually shifted, rather than just stabilized.
In that scenario, the steady stream of positive news could start acting as genuine fundamental support. Deals involving Wisk Aero, Insitu, and SkyGrid, along with FAA-backed flight milestones, would then carry more weight.
Bearish Scenario
The bearish case for Archer Aviation stock remains straightforward. Failure to hold daily support at $5.40 opens the door toward the lower Bollinger band at $5.29.
A break below $5.29, especially on rising volume, would suggest the broader downtrend remains firmly in place. The EMA200 at $6.52 continues to define that trend from above.
Continued weakness on the hourly chart would further validate the bearish tone. A drop through the $5.47 support zone would confirm sellers are still setting the tone, despite the positive headlines.
Closing Take on Archer Aviation Stock
Archer Aviation stock is caught between an improving operational story and a technical picture that has not yet turned. Elevated volatility means sharp moves in either direction remain firmly on the table.
ATR readings across timeframes reflect this elevated volatility relative to the share price. Positioning here requires patience. The daily trend still leans cautious, and the hourly chart confirms that caution.
Only the 15-minute picture offers early, unconfirmed signs of oversold conditions. Until price reclaims key levels like the $5.60 pivot or $5.68 EMA50, uncertainty is likely to remain the dominant theme.
FAQ
Is Archer Aviation stock a buy at current levels?
The technical picture remains bearish across daily and hourly timeframes. With RSI at 44.87 on the daily chart and price below all key EMAs, the stock has not yet shown a confirmed reversal. Positive fundamentals — including the Wisk Aero acquisition and Midnight eVTOL milestones — offer long-term potential, but price action has not aligned with the news yet.
What are the key support levels for ACHR?
The immediate support for Archer Aviation stock sits at $5.40, the daily S1 pivot. Below that, the lower daily Bollinger band at $5.29 is the next level to watch. On the hourly chart, the $5.47–$5.48 cluster serves as the intraday floor. A break below these levels on rising volume would reinforce the bearish structure.
What would signal a bullish reversal for Archer Aviation stock?
A bullish reversal would require ACHR to reclaim the daily pivot at $5.60 first, then push above the EMA50 at $5.68. A close above the EMA20 near $5.79 would provide stronger confirmation. RSI moving back above 50 on both daily and hourly charts would confirm momentum has actually shifted.
Article produced with the assistance of artificial intelligence and reviewed by the editorial team.
Disclaimer: The content of this article solely reflects the author's opinion and does not represent the platform in any capacity. This article is not intended to serve as a reference for making investment decisions.
You may also like
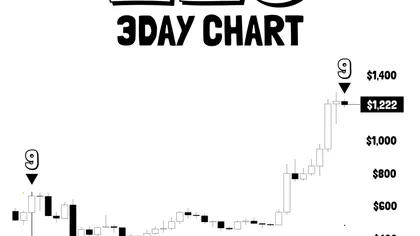
Zcash (ZEC) Prints TD Sequential ‘9’ Sell Signal — Last Time It Appeared, Price Fell 64%
Why Is VTHO Up 38.57% in 24 Hours? Extreme Funding Rate and Liquidation Data Explained

India’s $2B Agricultural Credit Network Moves Onchain via Avalanche and Arya.ag

Crypto prices
More


