
Lighter Crypto Battles $0.78 Resistance as Daily Downtrend Persists

As of September 8, 2026, a tug-of-war is unfolding in Lighter crypto, with the daily chart still flashing bearish while short-term price action attempts a recovery. The broader market adds pressure: total crypto capitalization slipped 3.02% to roughly $2.68 trillion, even as the Fear & Greed Index remains in Greed territory at 69.
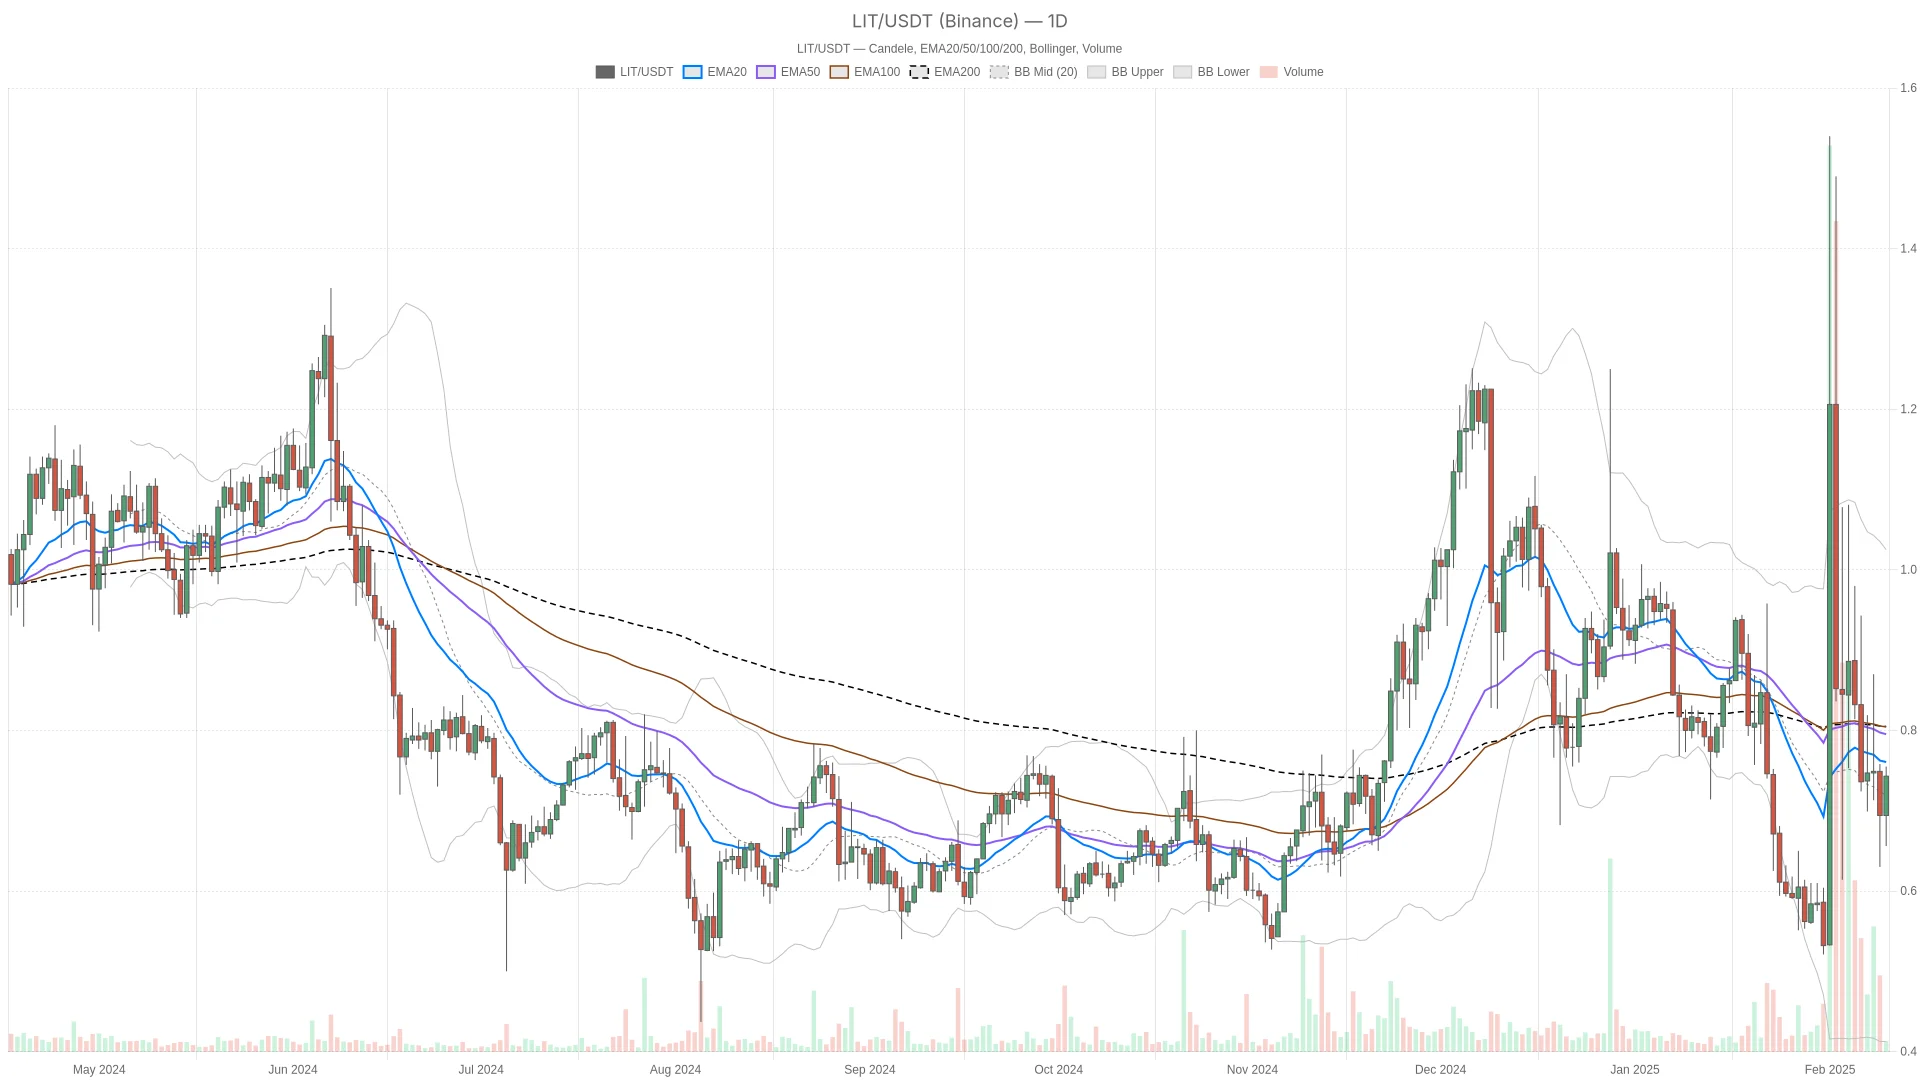 LIT/USDT — daily chart with candlesticks, EMA20/EMA50 and volume.
Summary
Key takeaways
- LIT is trading at $0.74 on September 8, 2026, sitting below all three daily EMAs in a fully bearish configuration.
- Daily RSI at 48.64 and a flat MACD histogram indicate stalled downside momentum rather than a confirmed reversal.
- Intraday charts show buying interest with price above short-term EMAs, though the EMA200 at $0.77 still caps the recovery.
- An elevated ATR of $0.26 signals extreme volatility relative to the token price.
- Key levels to monitor: resistance at $0.78 (R1) and support at $0.68 (S1).
The Daily Chart Still Belongs to the Bears
On the daily timeframe, LIT closed at $0.74, sitting below its EMA20 ($0.76), EMA50 ($0.80), and EMA200 ($0.80). That is a fully bearish stack — short, medium, and long-term averages are all overhead. When price trades under all three moving averages, every bounce technically happens inside a downtrend until proven otherwise.
However, the daily RSI at 48.64 sits on the fence — not oversold, not overbought, just neutral. It does not scream exhaustion to the downside, nor does it confirm strength. The MACD tells a similar story: line and signal sit at -0.01 with a flat histogram of 0. Downside momentum has stalled rather than reversed. Sellers are not in full control, but buyers have not taken over yet.
Bollinger Bands on the daily are wide, with the mid-band at $0.72 and bands stretching from $0.41 up to $1.03. That width reflects heavy past volatility and aligns with a daily ATR of $0.26 — a huge figure for a $0.74 token. The daily pivot has price at $0.74, above the pivot point of $0.72. It presses toward R1 at $0.78, with support underneath at S1 ($0.68).
Intraday Action Shows a Recovery Attempt
On the 1-hour chart, however, the picture softens. Price at $0.74 now sits above both the EMA20 ($0.71) and EMA50 ($0.73), though it remains capped by the EMA200 at $0.77. That is a classic short-term recovery setup forming underneath a longer-term ceiling. RSI on the 1H has climbed to 55.44, a modest tilt toward buyers, while MACD remains flat and slightly negative. Momentum has not fully flipped, but it is no longer deteriorating either.
The 15-minute chart shows the bullish attempt most clearly. Price trades above all three EMAs — the 20 at $0.69, 50 at $0.70, and 200 at $0.73. RSI has pushed up to 67.24, nearing overbought territory. MACD sits flat at zero, so there is no strong acceleration, just a grind higher. Taken together, the intraday picture reveals real buying interest stepping in, but it is happening inside a daily structure that remains bearish. That is the core tension.
Bullish and Bearish Scenarios
The bullish case for Lighter crypto builds if price clears the daily R1 resistance at $0.78 and holds above the daily EMA20 at $0.76. A close through that zone, with daily RSI above 50 and MACD turning positive, would start challenging the bearish daily regime. That would open a path toward the $0.80 cluster where EMA50 and EMA200 both sit. Reclaiming that level would be the first real sign the downtrend is losing its grip.
The bearish case, meanwhile, is just as straightforward. A rejection at R1 or a failure to hold the daily pivot at $0.72 would send price back toward S1 at $0.68. Given that the daily trend remains bearish and the EMA200 at $0.80 stays well overhead, a rollover here would confirm trend continuation. With a daily ATR of $0.26, downside moves can extend quickly once support gives way. The wide Bollinger Band floor near $0.41 is a reminder of how far price can stretch if selling pressure returns.
Positioning and Risk Going Forward
Right now, LIT presents a textbook case of conflicting timeframes. The daily chart signals a downtrend, while the hourly and 15-minute charts suggest a relief rally. Neither side has fully won the argument. Traders leaning bullish on intraday strength must respect that they are trading against the higher timeframe trend until the $0.78–$0.80 zone is reclaimed with conviction. Traders leaning bearish must acknowledge that momentum has clearly stalled on the daily, and a squeeze toward resistance remains in play.
Moreover, the macro backdrop adds caution. Total market cap is down over 3% in a day, Bitcoin dominance sits near 59%, and sentiment still reads greedy despite the pullback. Fresh security headlines around Bitcoin add another layer of uncertainty. Volatility, as the ATR readings confirm, is elevated on every timeframe. This is a moment to watch the reaction at key levels rather than assuming either direction will continue on autopilot.
FAQ
Is LIT still in a downtrend?
Yes. On the daily timeframe, LIT remains below all three key EMAs — the EMA20 at $0.76, EMA50 at $0.80, and EMA200 at $0.80 — a configuration the system flags as outright bearish.
What are the critical levels to watch for LIT?
Resistance sits at $0.78 (daily R1) and the $0.80 EMA cluster. Support lies at the daily pivot of $0.72 and S1 at $0.68. A decisive break of either zone would likely determine the next directional move.
Does the intraday recovery signal a trend reversal?
Not necessarily. The hourly chart shows price above the EMA20 and EMA50 but still capped by the EMA200 at $0.77. The recovery resembles consolidation after a bounce, and a confirmed reversal would require a daily close above $0.78–$0.80 with momentum confirmation.
Article produced with the assistance of artificial intelligence and reviewed by the editorial team.
Disclaimer: The content of this article solely reflects the author's opinion and does not represent the platform in any capacity. This article is not intended to serve as a reference for making investment decisions.
You may also like
Ethereum leads tokenized fund sector with 47% market share

Jamie Dimon Hated Bitcoin: JPMorgan Now Expects BTC to Beat Stocks and Gold
Stablecoin deposits in DeFi rise 560.8% in three years as lending pools log outflows
Bitcoin faces $11 billion options expiry, Fed decision, and GDP data this week

Crypto prices
More


