coinedition.com
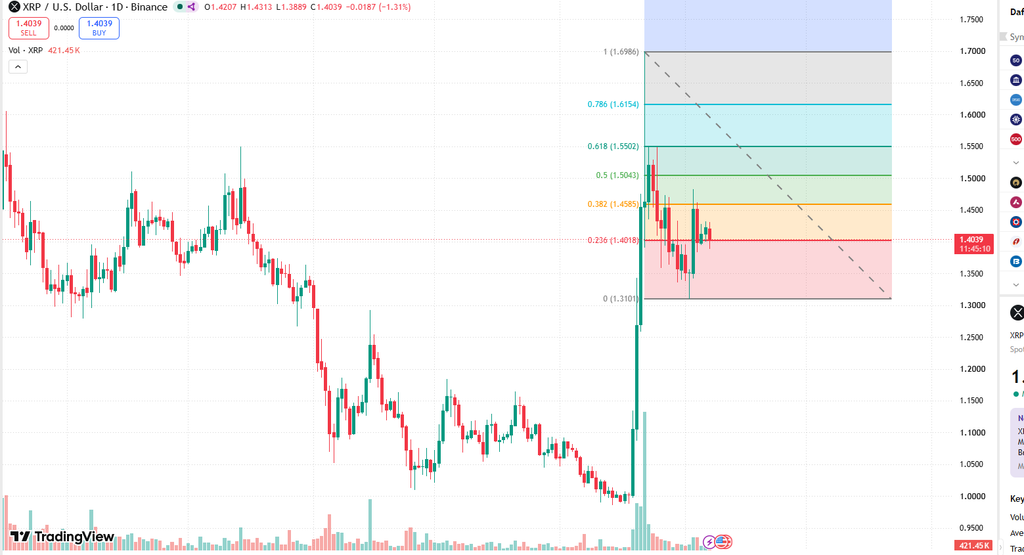
$XRP is consolidating after swinging between a low near $1.31 and a high around $1.70, with price now stabilizing in a retracement phase.
At the time of writing, $XRP trades near the 0.236 Fibonacci level around $1.40, after failing to hold above the 0.382 resistance near $1.45. The rejection points to weakening bullish momentum, with the market now boxed into a short-term range between $1.34 support and $1.45 resistance.
 Source: TradingView
Structure Points to $1.45 as the Level to Beat
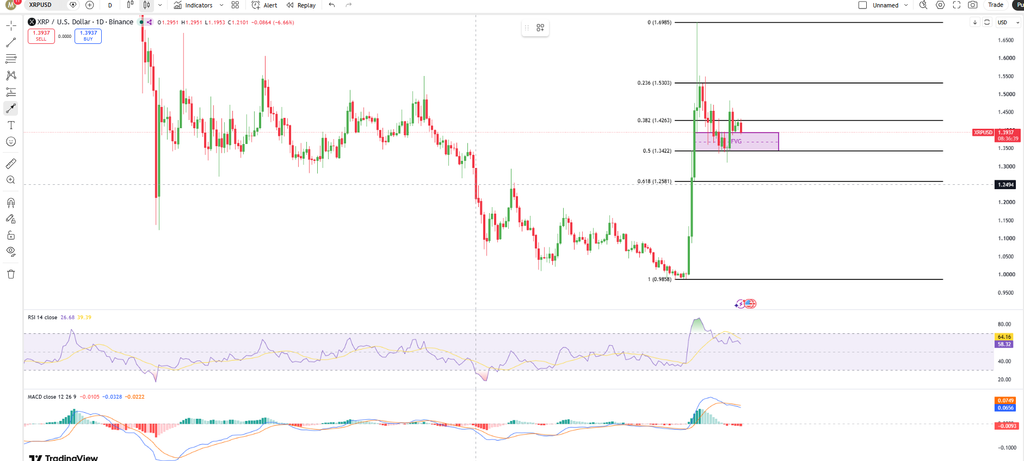
From a structural perspective, the recent rally began after price broke above a previously existing Fair Value Gap (FVG), an existing imbalance zone. That’s left $1.45 as the level to beat: price has failed to sustain a move above it more than once, a sign of supply absorbing every push higher.
 Source: TradingView
RSI and MACD Confirm Fading Momentum
Furthermore, technical indicators support the current weakness. The Relative Strength Index (RSI) remains in neutral territory but is trending downward, suggesting fading buying strength. At the same time, the Moving Average Convergence Divergence (MACD) shows bearish signals, with the MACD line positioned below the signal line and a red histogram indicating increasing downside momentum.
Neither side has taken control yet. $XRP has struggled to build acceptance above the mid-range Fibonacci levels, and that indecision is the defining feature of the current chart.
Levels to Watch on Either Side
A sustained break above $1.45 would be the first sign of renewed strength, though stronger confirmation comes at the 0.5 Fibonacci level near $1.50, clearing that opens a path toward $1.55 and potentially a retest of the $1.70 high.
The downside case is just as clear. Losing $1.34 would put $XRP on track for the $1.25 region, where the 0.618 retracement of the broader $0.90-to-$1.70 move sits, a zone likely to act as high-liquidity demand if price gets there.
For now, $1.34 and $1.45 define the range. Whichever side breaks first sets the next direction.
Related: $XRP Price Prediction: Can Falling Exchange Supply Offset a $7.2M ETF Outflow?