
Commodity Support and Resistance at a Glance: Gold, Silver, Oil, Gas, Platinum, Palladium, Copper, and Agricultural Futures (September 7, 2026)

Huitong Net, September 7th — A chart showing commodity support and resistance: gold, silver, oil, gas + platinum, palladium, copper + agricultural futures, updated on Monday, September 7, 2026 at 08:10 (UTC+8). Specifically covers 14 products including gold, silver, platinum, palladium, copper + crude oil, natural gas, fuel oil + wheat, corn, and cotton. For more details, refer to the custom chart in Huitong Finance Xiruo.
A chart showing commodity support and resistance: gold, silver, oil, gas + platinum, palladium, copper + agricultural futures, updated on Monday, September 7, 2026 at 08:10 (UTC+8). Specifically covers 14 products including gold, silver, platinum, palladium, copper + crude oil, natural gas, fuel oil + wheat, corn, and cotton. For more details, refer to the custom chart in Huitong Finance Xiruo.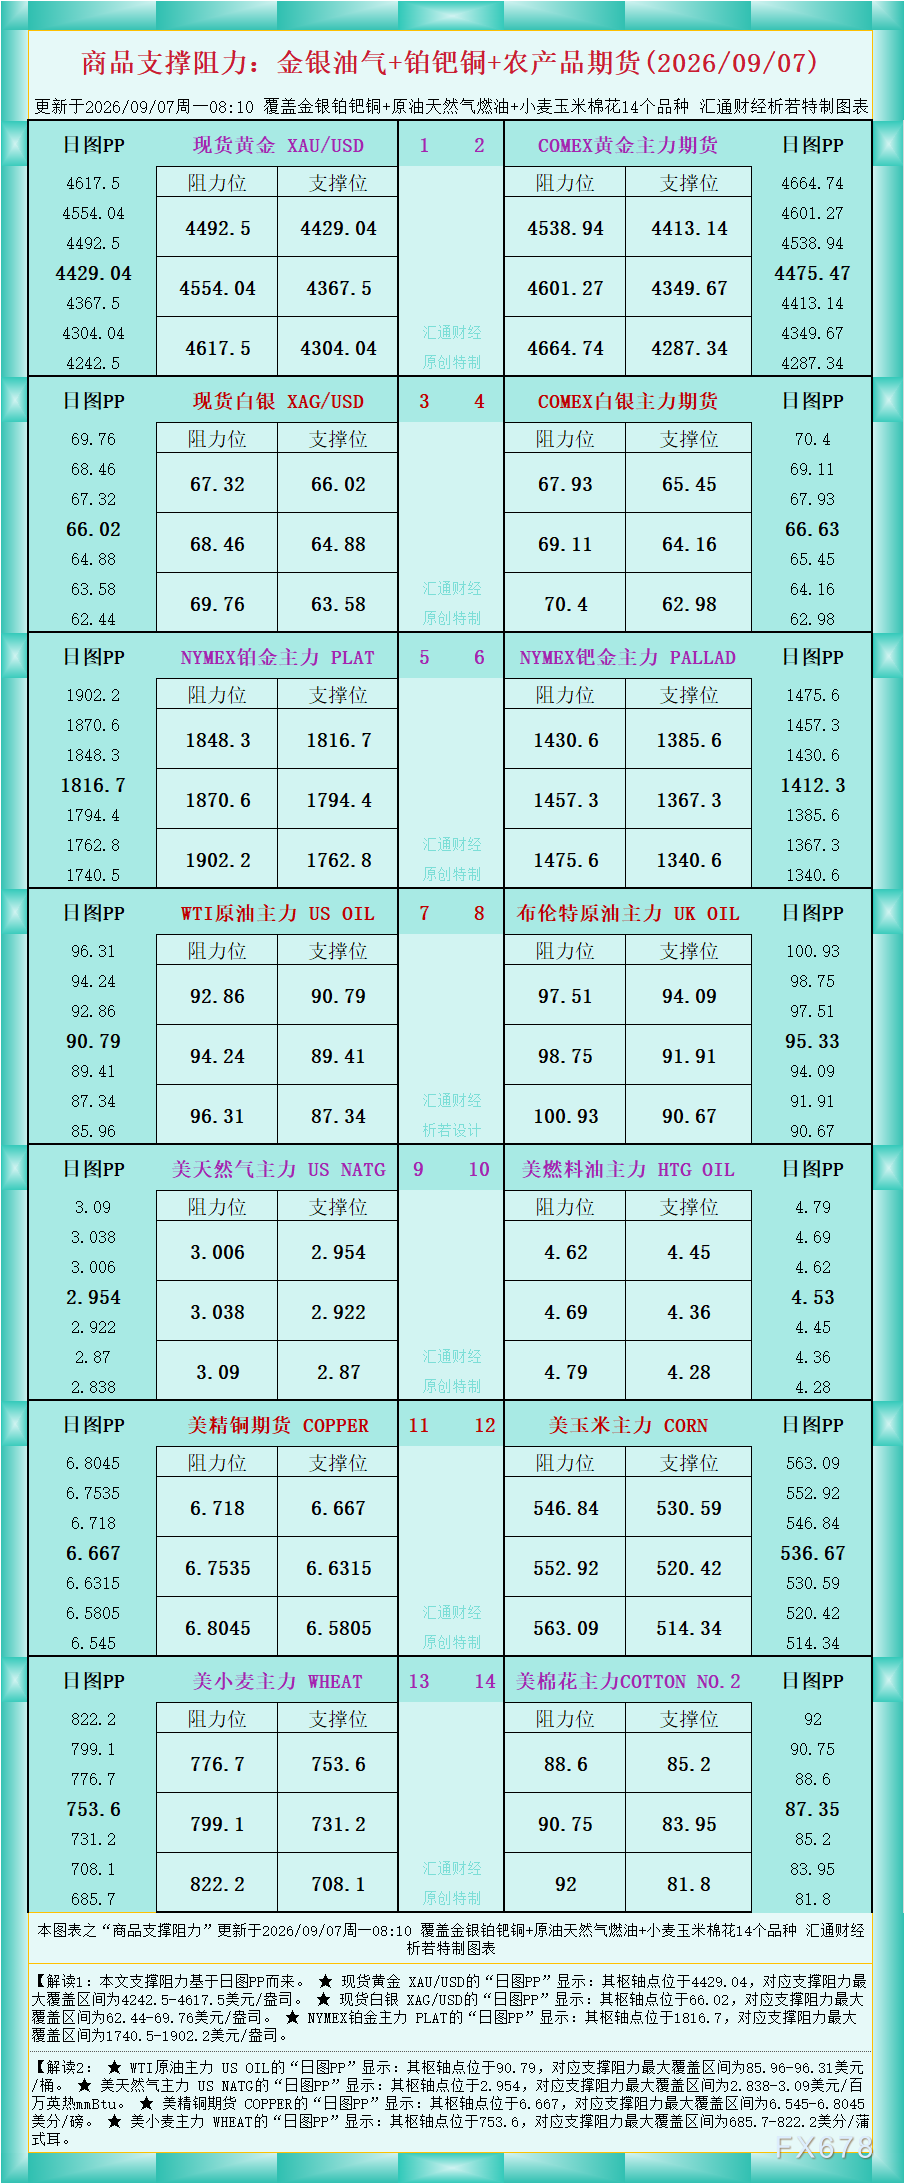
As shown in the chart, Interpretation 1: The support and resistance in this article are based on the daily chart PP.
★ The "daily chart PP" for spot gold XAU/USD shows: the pivot point is at 4429.04, with the maximum support and resistance range at $4,242.5–$4,617.5/oz.
★ The "daily chart PP" for spot silver XAG/USD shows: the pivot point is at 66.02, with the maximum support and resistance range at $62.44–$69.76/oz.
★ The "daily chart PP" for NYMEX platinum main contract PLAT shows: the pivot point is at 1,816.7, with the maximum support and resistance range at $1,740.5–$1,902.2/oz.
Interpretation 2:
★ The "daily chart PP" for WTI crude oil main contract US OIL shows: the pivot point is at 90.79, with the maximum support and resistance range at $85.96–$96.31/barrel.
★ The "daily chart PP" for US natural gas main contract US NATG shows: the pivot point is at 2.954, with the maximum support and resistance range at $2.838–$3.09/million BTU.
★ The "daily chart PP" for US copper futures COPPER shows: the pivot point is at 6.667, with the maximum support and resistance range at 6.545–6.8045 cents/pound.
★ The "daily chart PP" for US wheat main contract WHEAT shows: the pivot point is at 753.6, with the maximum support and resistance range at 685.7–822.2 cents/bushel.
For more product interpretations, please refer to the chart.
Disclaimer: The content of this article solely reflects the author's opinion and does not represent the platform in any capacity. This article is not intended to serve as a reference for making investment decisions.
You may also like
United Kingdom: Growth pace cools after hot start – Deutsche Bank
10-Yr Benchmark Govt Yields - U.S. vs Other Nations
10-Yr Benchmark Govt Yields - Germany vs Other Nations
Crypto prices
More


