
Hewlett Packard Enterprise Comp stock holds $50.83 support as earnings loom

Hewlett Packard Enterprise Comp stock closed at $51.78, trapped between $50.43 and $51.94. The daily chart still shows a long-run uptrend, but short-term momentum has faded. With earnings due this week, the tension between structural strength and tactical weakness now defines the setup.
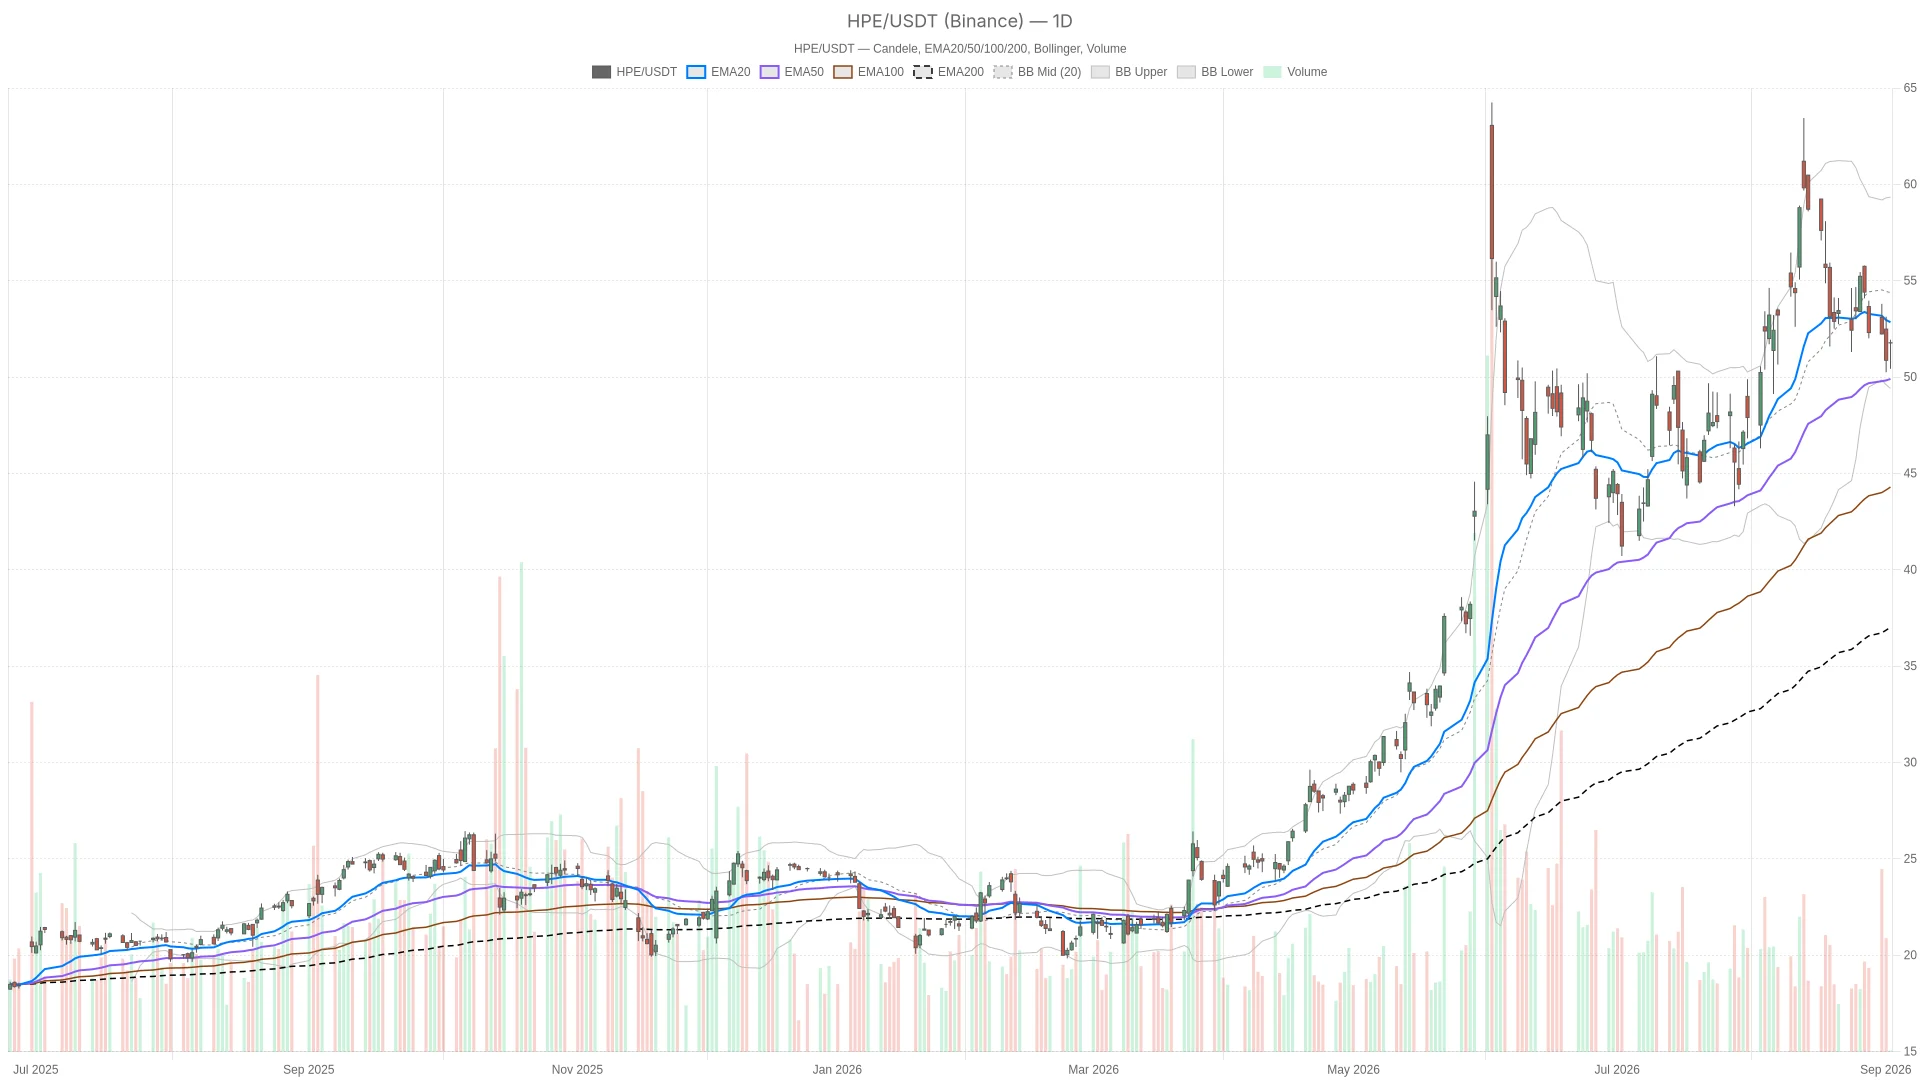 HPE — daily chart with candlesticks, EMA20/EMA50 and volume.
Summary
- Key takeaways
- Hewlett Packard Enterprise Comp Stock: Daily Trend Still Intact, But Momentum Has Cooled
- 1H Chart Confirms the Short-Term Pressure
- 15-Minute Chart: Early Bounce Attempt Underway
- What Would Confirm the Bullish Scenario for HPE Stock
- What Would Invalidate the Bullish Case
- Closing Take on Hewlett Packard Enterprise Comp Stock
- FAQ
Key takeaways
- HPE stock closed at $51.78, holding within a tight pre-earnings range between $50.43 and $51.94.
- The daily uptrend remains intact with price well above the 200-day EMA at $37.02, though momentum has cooled to a neutral RSI of 48.32.
- Short-term pressure is evident: the 1-hour chart shows price below all three key EMAs, confirming the pullback has real weight.
- Earnings are the catalyst this week, with margins at 21.6% — not AI order growth — being the market’s primary focus.
- Decisive support sits at $50.83; a break below would open the path toward the daily 50-EMA at $49.90.
Hewlett Packard Enterprise Comp Stock: Daily Trend Still Intact, But Momentum Has Cooled
The daily trend for Hewlett Packard Enterprise Comp stock remains bullish. Price at $51.78 sits well above the 200-day EMA at $37.02, confirming the multi-month uptrend is unbroken.
However, the shorter moving averages tell a more cautious story. The close is below the 20-day EMA at $52.85, though still above the 50-day EMA at $49.90. This alignment points to consolidation after a strong advance — not a breakdown.
Meanwhile, momentum backs up that reading. The daily RSI sits at 48.32, essentially neutral. The MACD line at 0.55 sits below its signal at 1.28, producing a negative histogram of -0.72. In plain terms, upside momentum has faded from its peak. Yet the broader trend structure has not reversed.
Bollinger Bands add further context. The mid-band sits at $54.38. Price trades below it, closer to the lower band at $49.41 than the upper band at $59.34. This positioning suggests the stock has pulled back from the upper half of its volatility envelope. Daily ATR of $2.30 confirms this remains an actively moving name.
At the current juncture, the daily pivot at $51.38 frames the immediate battleground. Resistance stands at $52.34 and support at $50.83 — almost exactly where price is trading now.
1H Chart Confirms the Short-Term Pressure
The 1-hour chart confirms short-term sellers have the edge. HPE stock trades below all three key hourly EMAs.
In detail, price at $51.72 sits below the 20-hour EMA at $51.87, the 50-hour at $52.83, and the 200-hour at $52.13. That bearish EMA stack confirms the daily pullback has real short-term weight. RSI at 45.23 leans soft. The MACD line at -0.70 versus a signal of -0.66 keeps the histogram negative at -0.03, though it is narrowing.
Meanwhile, Bollinger Bands on the 1H chart show the mid-band at $51.85 with price hovering just underneath. The range sits between the lower band at $50.17 and the upper band at $53.54. In short, the hourly chart agrees with the daily: momentum has stalled and sellers have had the edge in the very short term.
Therefore, the daily and hourly timeframes align in direction. The daily trend remains constructive on a longer horizon. Still, this is a strong trend pausing to digest gains ahead of a known catalyst — not a case of conflicting signals.
15-Minute Chart: Early Bounce Attempt Underway
The 15-minute chart reveals an early tactical bounce in HPE stock. RSI has climbed to 61.64 and the MACD histogram has turned positive at 0.14.
In detail, the MACD line at -0.16 has crossed above the signal at -0.31. Price at $51.72 trades above both the 20-period EMA at $50.99 and the 50-period EMA at $51.55. Notably, it still sits below the 200-period EMA at $53.04. Price has also pushed above the upper Bollinger Band at $51.50 — a sign of short-term overextension after the recent dip.
This is purely execution-level context. It shows buyers stepping in near intraday support. However, it does not override the more cautious daily and hourly backdrop.
What Would Confirm the Bullish Scenario for HPE Stock
Bulls need HPE stock to reclaim the hourly EMA cluster between $51.87 and $52.83 and clear daily pivot resistance at $52.34.
Specifically, a sustained move back above the daily 20-EMA at $52.85 would signal the pullback is over and the primary uptrend is resuming. On the fundamental side, real catalysts are in play. HPE and Dell both report earnings this week. The market is watching whether AI infrastructure demand justifies current valuations.
Notably, a Seeking Alpha preview flagged that margins — cited at 21.6% — matter more than headline AI order growth this quarter. A strong margin print could give bulls the fundamental support needed. Combined with continued momentum in networking distribution following the Arrow Electronics agreement, this could push price back toward the daily Bollinger mid-band at $54.38 and eventually the upper band near $59.34.
What Would Invalidate the Bullish Case
The bullish case unravels if HPE stock breaks below daily support at $50.83 and the matching hourly support at $50.82.
In this scenario, a break below that zone would open the door toward the daily 50-EMA at $49.90 and the lower Bollinger Band at $49.41. A widening negative MACD histogram on the daily chart would confirm sellers are back in control. This would be more than the current narrowing pattern seen on the hourly chart.
In practice, earnings disappointment — particularly on margins — would be the most direct trigger. The market’s explicit focus on profitability makes this the key vulnerability. In contrast to the bullish path, this scenario would mark a genuine break in the longer-term structure rather than a routine consolidation.
Closing Take on Hewlett Packard Enterprise Comp Stock
Overall, Hewlett Packard Enterprise Comp stock sits at an inflection point. The long-term trend remains intact, but short-term momentum has clearly softened. The daily and hourly charts agree on near-term caution. Meanwhile, the 15-minute chart shows only a tentative bounce attempt that has not yet changed the broader picture.
At the same time, with earnings due this week and the market’s attention squarely on margins rather than order backlog, volatility around the report is likely to be elevated. Price sits near both the daily pivot and key support levels. Positioning here carries real two-way risk. Traders should treat the current range as a decision zone — not a settled trend — until the earnings catalyst resolves the uncertainty.
FAQ
What is the current trend for Hewlett Packard Enterprise Comp stock?
The daily trend remains bullish. Price at $51.78 sits well above the 200-day EMA at $37.02. However, short-term momentum has cooled, with the stock trading below the 20-day EMA and RSI at a neutral 48.32.
What are the key levels to watch for HPE stock?
Key resistance stands at $52.34 (daily pivot) and $52.85 (20-day EMA). Key support sits at $50.83 (daily pivot support) and $49.90 (50-day EMA). A break below $50.83 would open the path toward the lower Bollinger Band at $49.41.
What matters most in HPE’s upcoming earnings report?
Margins, cited at 21.6%, are the market’s primary focus — not headline AI order growth. A strong margin print could support the bullish case, while margin disappointment would be the most direct trigger for a breakdown.
{"@type":"FAQPage","mainEntity":[{"@type":"Question","name":"What is the current trend for Hewlett Packard Enterprise Comp stock?","acceptedAnswer":{"@type":"Answer","text":"The daily trend remains bullish. Price at $51.78 sits well above the 200-day EMA at $37.02. However, short-term momentum has cooled, with the stock trading below the 20-day EMA and RSI at a neutral 48.32."}},{"@type":"Question","name":"What are the key levels to watch for HPE stock?","acceptedAnswer":{"@type":"Answer","text":"Key resistance stands at $52.34 (daily pivot) and $52.85 (20-day EMA). Key support sits at $50.83 (daily pivot support) and $49.90 (50-day EMA). A break below $50.83 would open the path toward the lower Bollinger Band at $49.41."}},{"@type":"Question","name":"What matters most in HPE's upcoming earnings report?","acceptedAnswer":{"@type":"Answer","text":"Margins, cited at 21.6%, are the market's primary focus — not headline AI order growth. A strong margin print could support the bullish case, while margin disappointment would be the most direct trigger for a breakdown."}}]}
Article produced with the assistance of artificial intelligence and reviewed by the editorial team.
Disclaimer: The content of this article solely reflects the author's opinion and does not represent the platform in any capacity. This article is not intended to serve as a reference for making investment decisions.
You may also like
Aave commands 48% of DeFi loans, yet $17B sits idle – Here’s why V4 matters!
Bitcoin and XRP Price Rally Faces Downside Risk as Bearish ‘Bart Simpson’ Pattern Emerges
NEAR Sits on a Liquidity Pool That Has Held for Years, Can the Altcoin Catapult to $10 and $20 Soon?

XRP trades at $1.32 as Washington debates crypto integration rules
Crypto prices
More


