
Bitcoin begins volatile monthly close as US bond yields eye new 20-year high

Bitcoin (BTC) gyrated around $78,000 at Monday’s Wall Street open as US bond yields neared 20-year highs again.
Key points:
- Bitcoin reacts as the US Treasury Secretary comments on bond markets in a mainstream media interview.
- Analysis warns that bonds are “ignoring” policy changes as new 20-year highs loom for the 30-year yield.
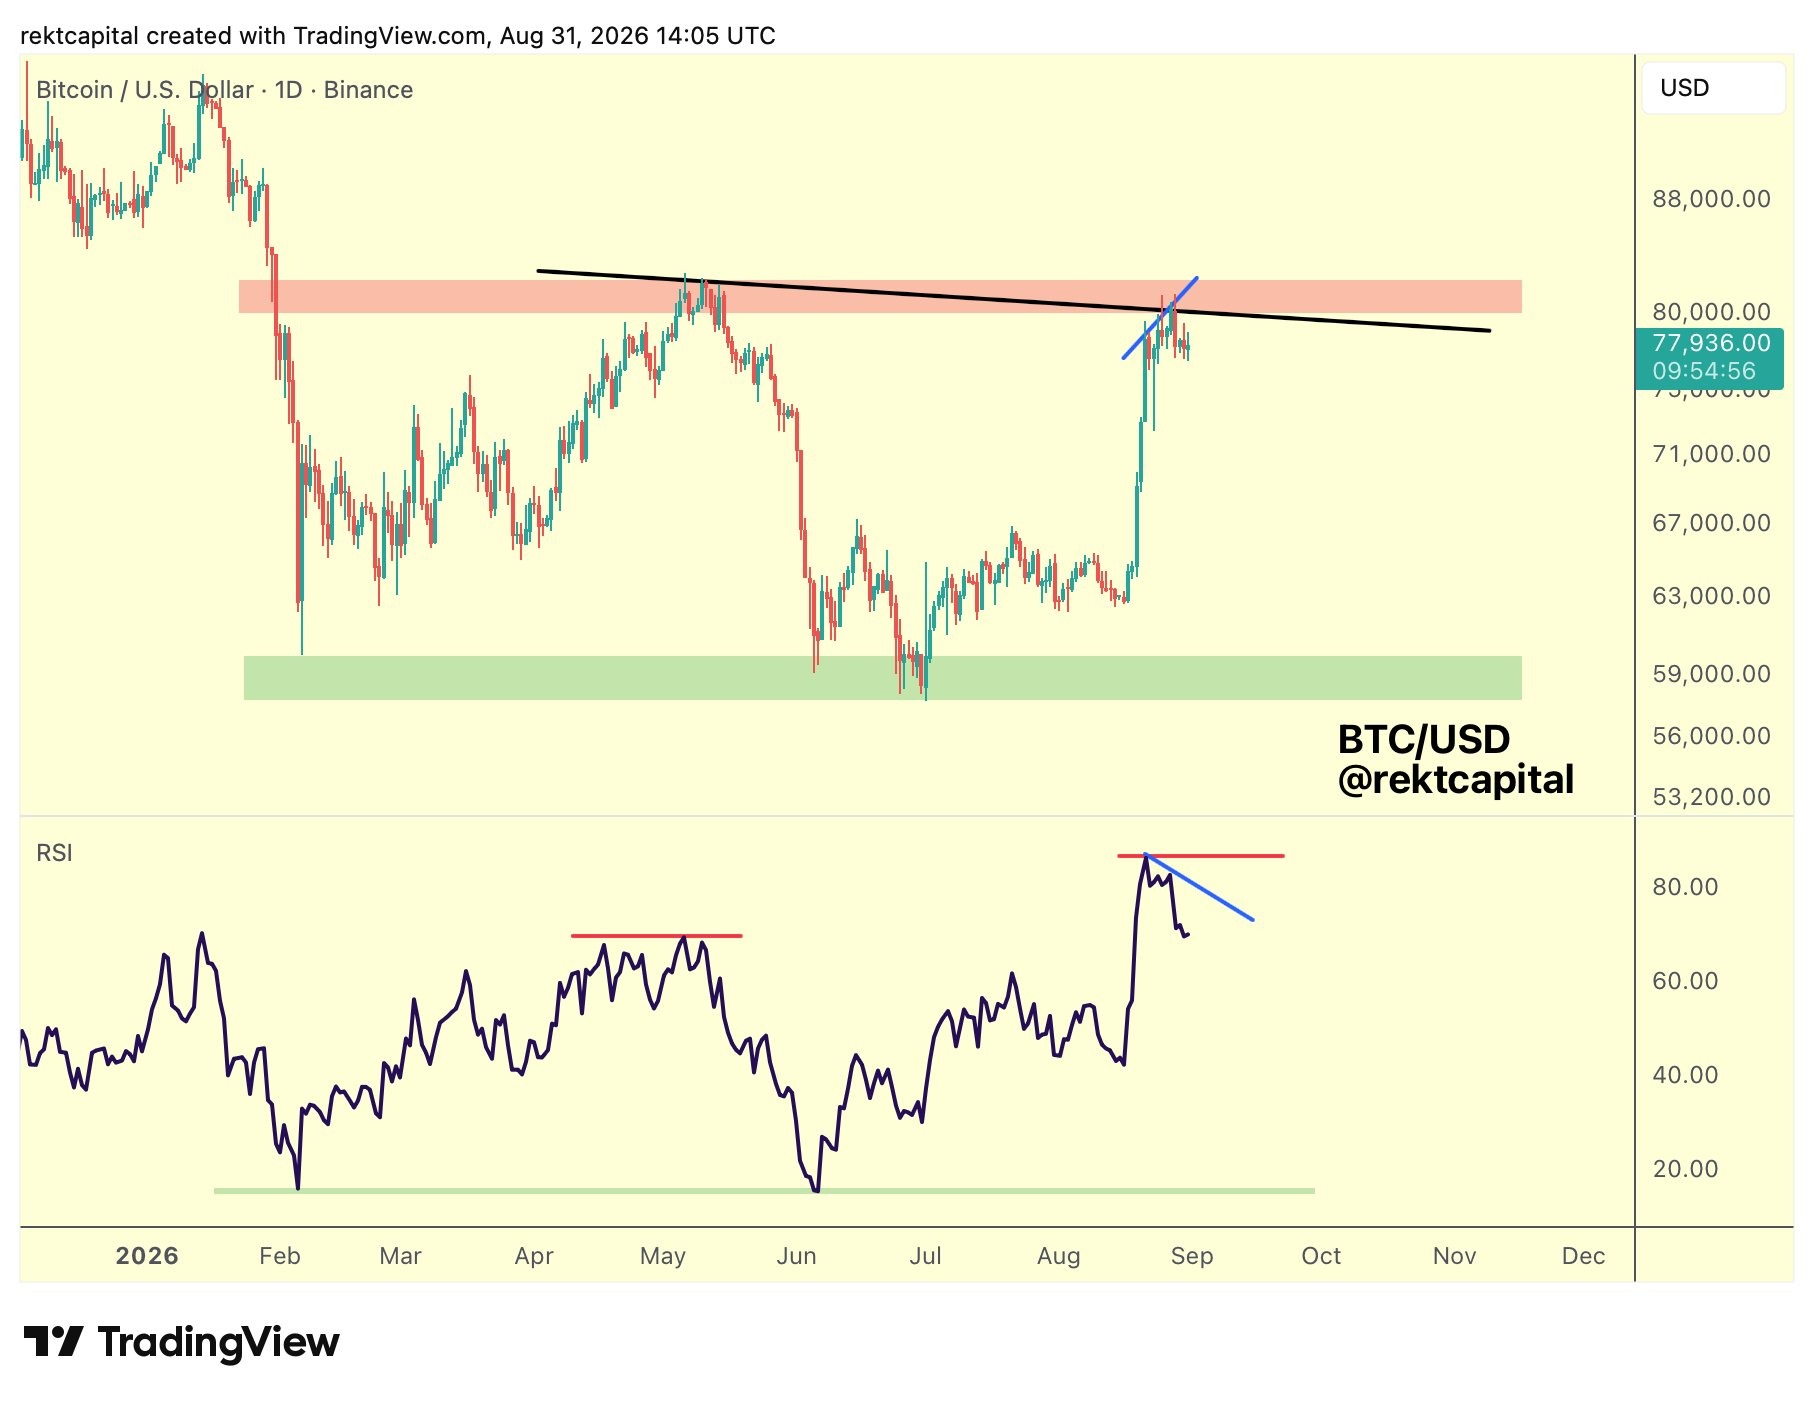
- BTC price analysis sees an emerging hidden bearish RSI divergence contributing to month-end weakness.
Bitcoin spikes as Bessent discusses bond yields
Data from TradingView showed BTC/USD trading in a narrow range, up around 1% on the day.
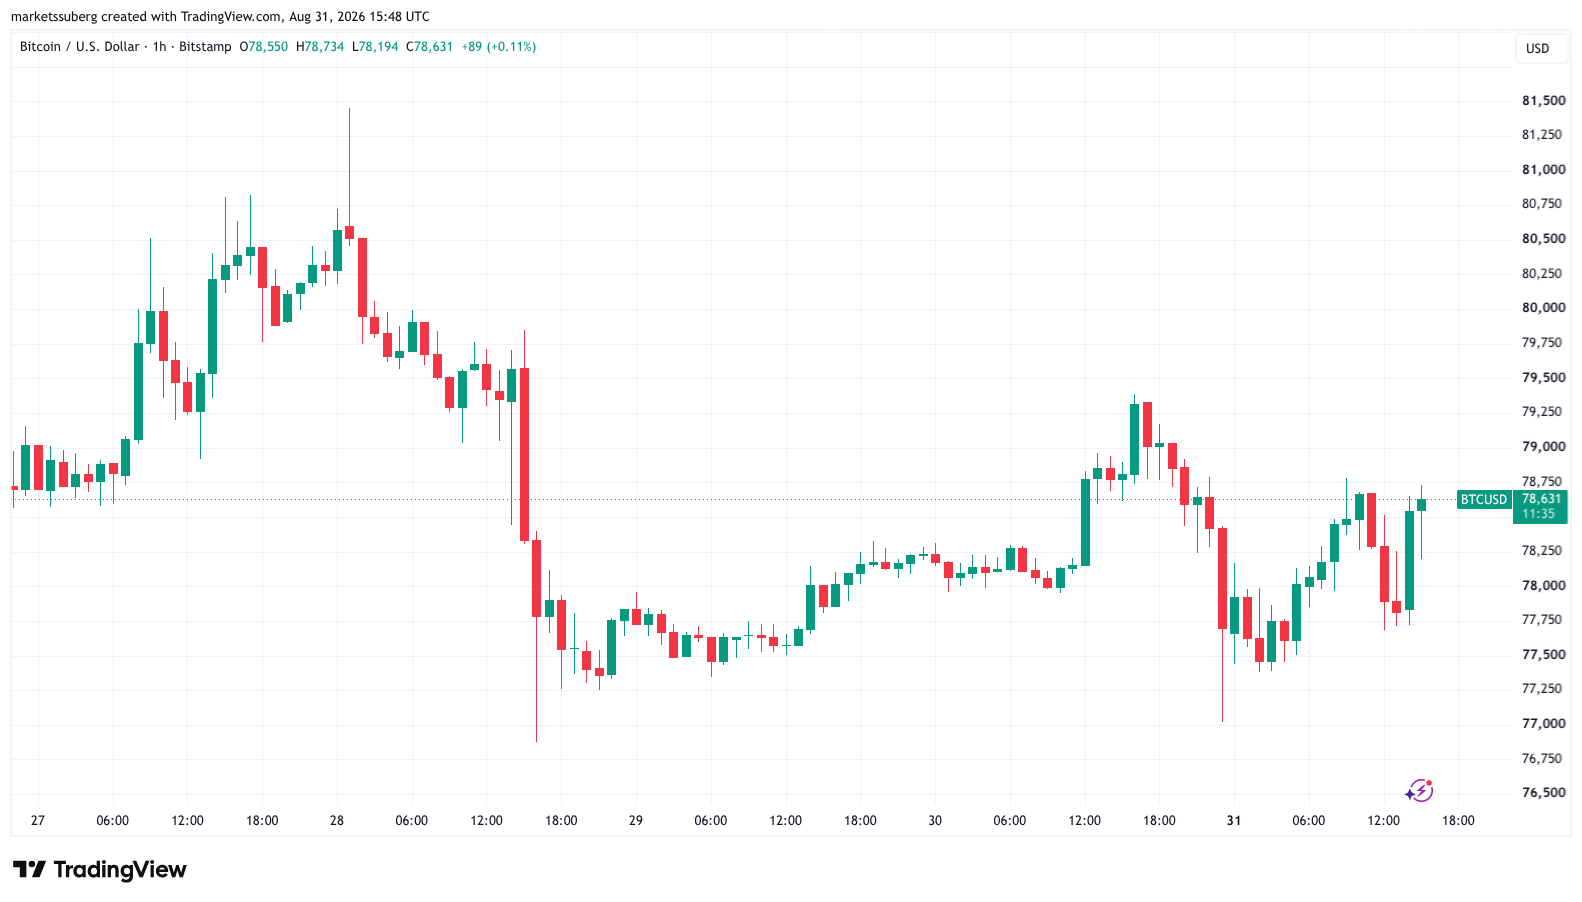
BTC/USD one-hour chart. Source: Cointelegraph/TradingView
After falling into the start of the US trading session, the pair saw a swift rebound as US Treasury Secretary Scott Bessent hinted at further interventions in the US bond market. In an interview with CNBC, Bessent stressed that he had not yet acted to shore up the long end of the yield curve — 10-year and 30-year bonds.
“I haven’t bought anything yet,” he told the network, adding that he was “fine” with yields rebounding after the announcement.
This month, the Treasury announced that it would be at least doubling the size of its debt buyback transactions to $4 billion from September. At the time, yields fell, but on Monday, the 10-year yield was back at its highest levels since January 2025 at 4.76%.
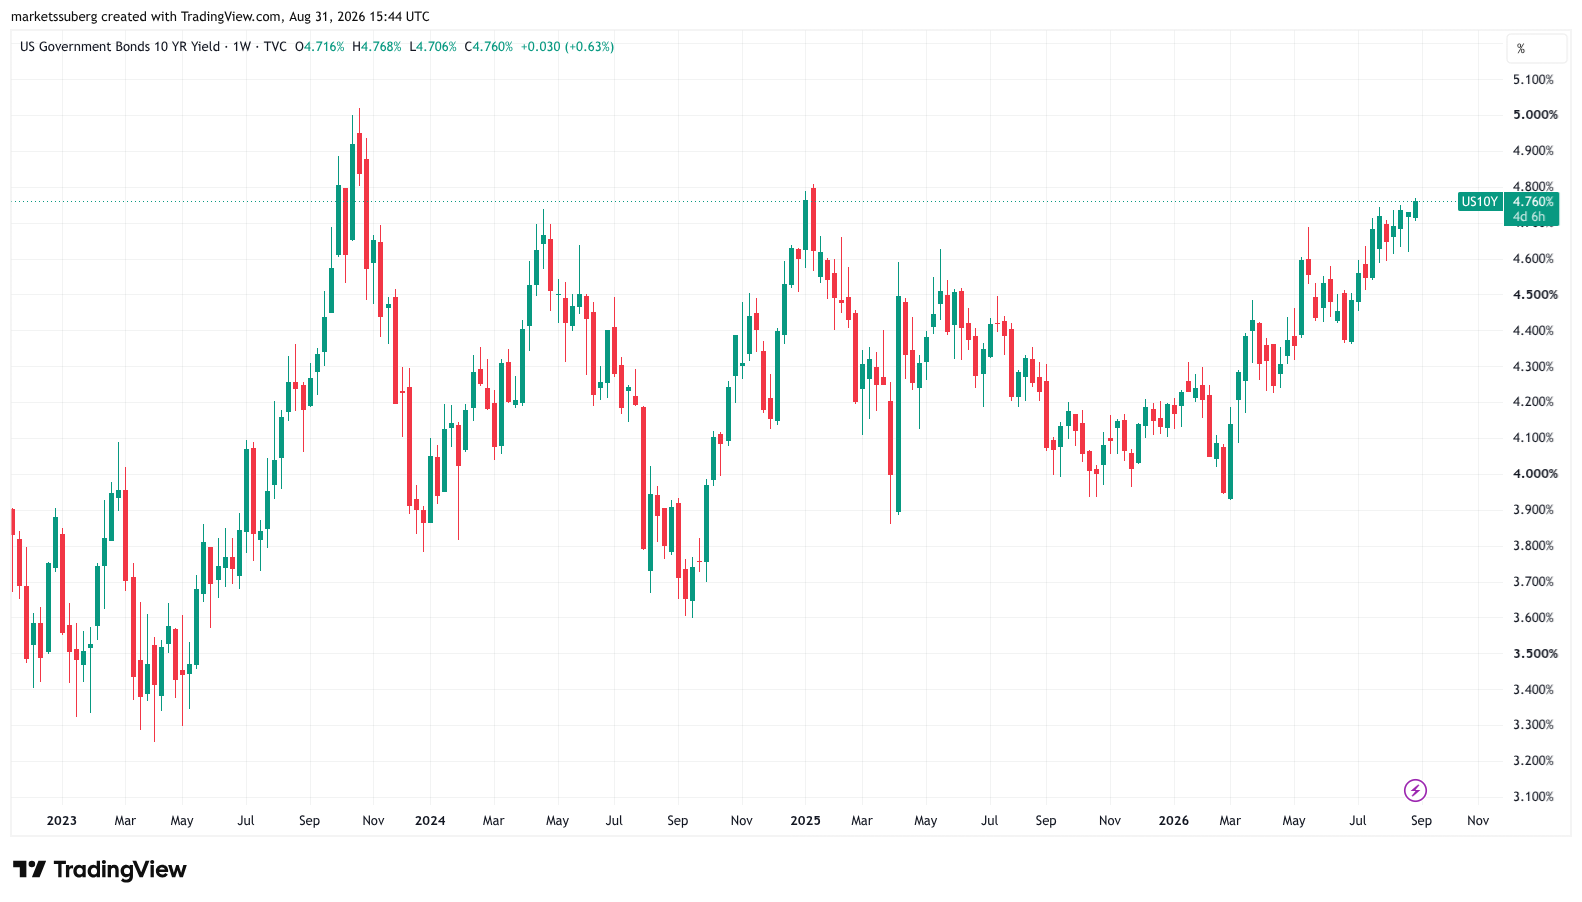
US 10-year bond yield one-week chart. Source: Cointelegraph/TradingView
The 30-year yield reached 5.269% on the day, six basis points short of its highest levels since January 2007.
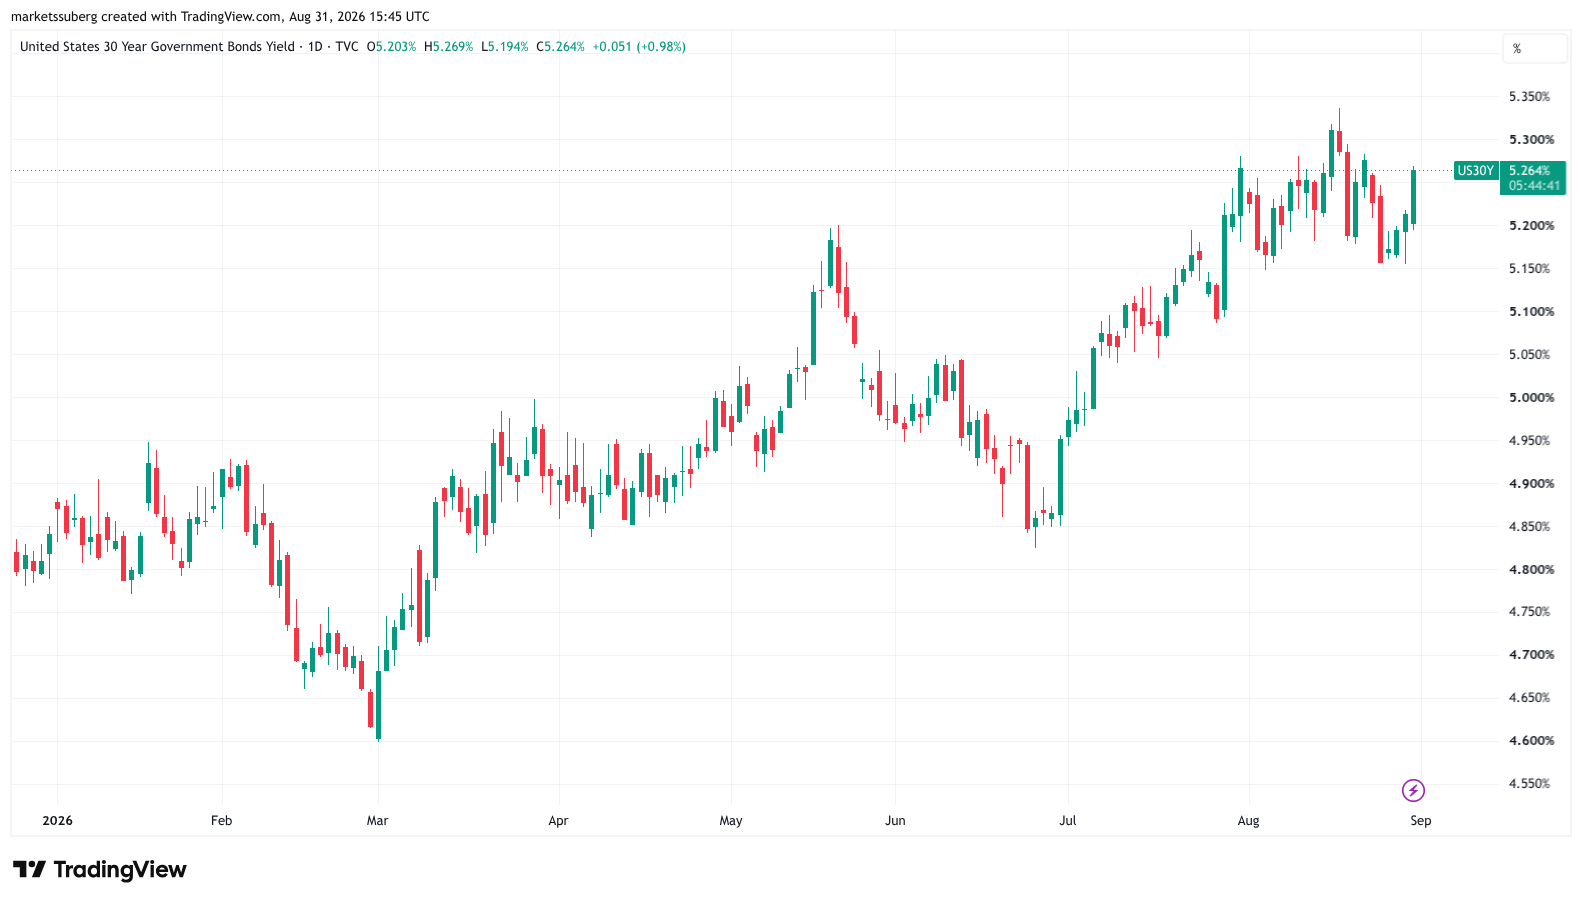
US 30-year bond yield one-day chart. Source: Cointelegraph/TradingView
Earlier, Ray Dalio expressed skepticism at the Treasury’s ability to control bonds, even under the new program. Forecasting a future US debt crisis, he named both Bitcoin and gold as potential hedges.
US stocks, meanwhile, remained red on the day, with both the S&P 500 and Nasdaq Composite Index trading around 0.4% lower as tensions over new US-Iran strikes filtered through to markets.
Bitcoin RSI sparks new bearish warning
Ahead of the August monthly candle close, BTC/USD maintained its 50-week exponential moving average (EMA) at $77,269 as support.
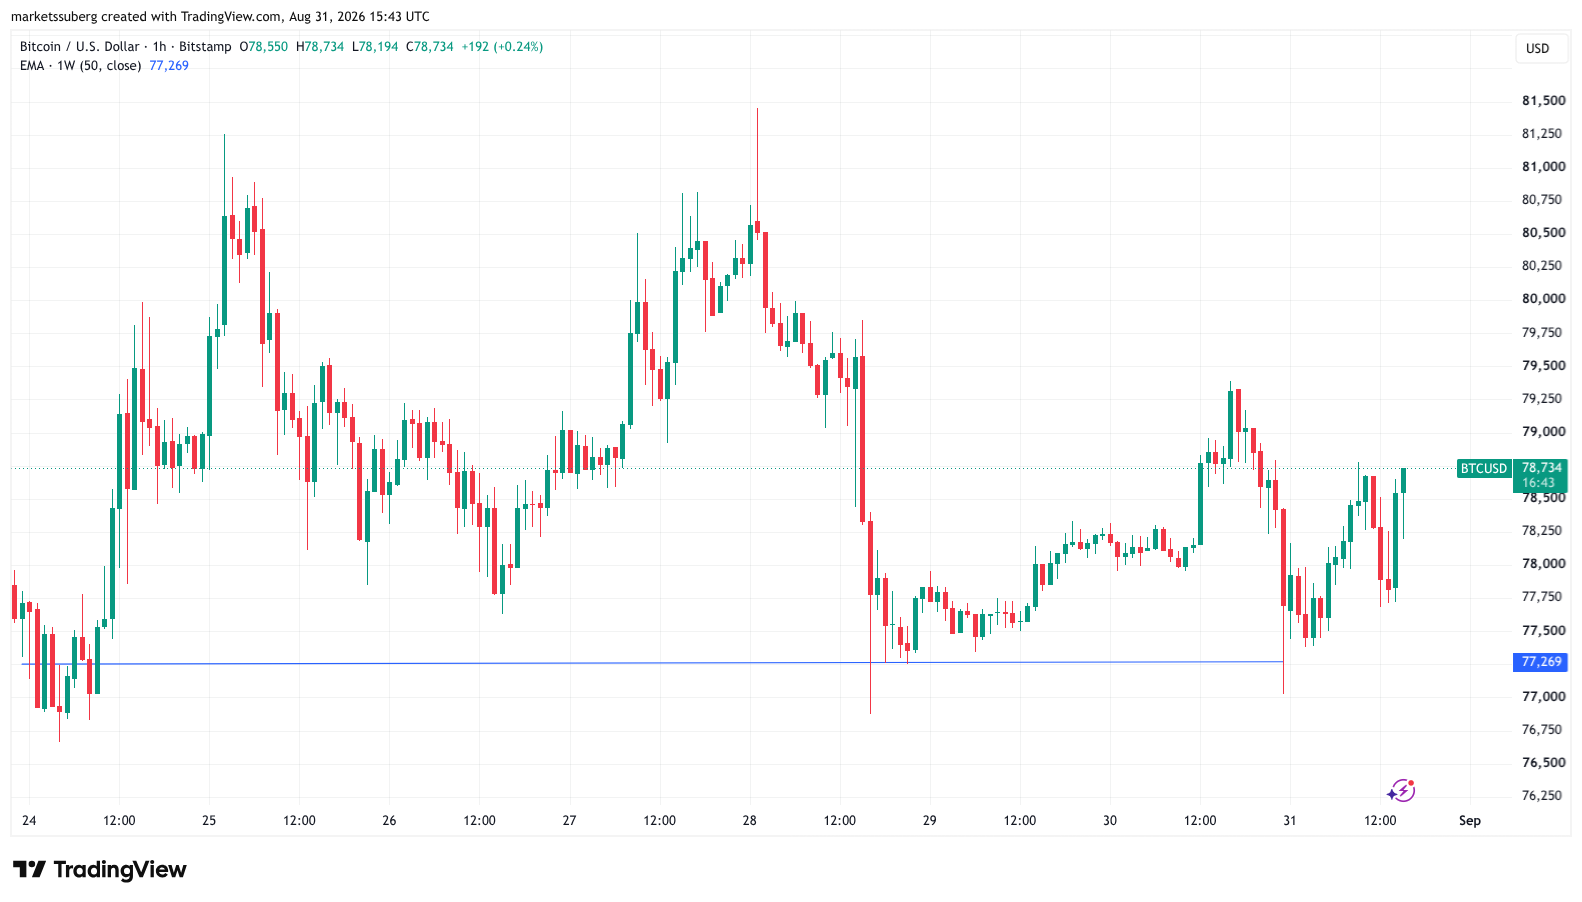
BTC/USD one-hour chart with 50-week EMA. Source: Cointelegraph/TradingView
Previously, Cointelegraph reported that this level is a key line in the sand for bulls. Month-to-date gains have neared 25% in Bitcoin’s best August performance since 2017.
In a note of caution, trader and analyst Rekt Capital warned of a hidden bearish divergence playing out on daily time frames between price and the relative strength index (RSI). Despite bullish RSI signals on the weekly chart, the latest daily values, he warned, pointed to waning momentum.
Daily RSI measured 70.7 on Monday, still within “overbought” territory.
Disclaimer: The content of this article solely reflects the author's opinion and does not represent the platform in any capacity. This article is not intended to serve as a reference for making investment decisions.
You may also like
Oxford Economics: Canada’s Economic Output May Drop 0.3% by 2027 as Retaliatory Tariffs Against U.S. Could Backfire
Oxford Economics warns that the new round of retaliatory tariffs against the US, scheduled to be implemented by Canada on September 8, may provide protection for some domestic manufacturers, but overall could cause more industries to face increased cost pressures and drag down Canada’s economic growth.

94% of Argentina peso crypto trading volume now stablecoins: a16z crypto
Strategy opposes MSCI plan to exclude MSTR from index, calls move discriminatory
Tesla holds 11,509 BTC as Bitcoin mining’s clean energy share tops 50% benchmark
Crypto prices
More


