

Shiba Inu (SHIB) has recently experienced a notable increase in exchange-related activity, yet key market indicators do not suggest an immediate end to its ongoing price decline. Despite a surge in certain inflow metrics, tokens are leaving trading platforms at a faster rate than they are entering.
Shiba Inu records $87 billion net outflow from exchanges, trades below $0.00000443
By:Cointurk
Bitget offers one-stop trading for cryptocurrencies, stocks, and gold. Trade now!
A welcome pack worth 6200 USDT for new users! Sign up now!
Exchange Flows Reflect Complex Market Conditions
Price Levels and Technical Signals
Market Dynamics and Real Demand
Exchange Flows Reflect Complex Market Conditions
The seven-day moving average of mean exchange inflows marks one of the most significant changes for SHIB. Over the last 24 hours, this metric rose by 87.76%, with shorter-term measurements showing an increase near 128%. In total, SHIB experienced inflows of approximately 147.57 billion tokens, a 1.9% increase.
While higher exchange inflows typically signal a greater risk of selling—since assets on exchanges can be more easily traded—this metric only reveals part of the picture. Total outflows climbed even more sharply, up 4.27% to 234.62 billion SHIB over the same period.
These figures result in a net flow of about -87.05 billion SHIB, reflecting a further 3.82% decline. Analysis of larger transactions supports this dynamic: inflows among the top 10 exchanges reached 3.32 billion SHIB, while outflows from these platforms stood even higher at 4.51 billion tokens, showing an increase of 9.68% for outflows.
ETH
SOL
BSC
ROBINHOOD
PAY
USDT
RECEIVE
AAPL
Despite the rise in inflows, SHIB is seeing stronger outflows from exchanges, leading to a net withdrawal of tokens and reduced overall supply held on trading platforms.
This net withdrawal dynamic creates a potential for a more favorable supply environment. Exchange reserves have dropped slightly, down 0.1% to stand at approximately 87.32 trillion SHIB.
Price Levels and Technical Signals
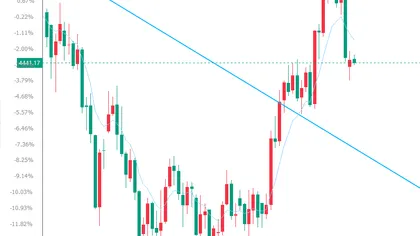
Despite these shifting on-chain movements, price action for SHIB remains subdued. The token continues to trade below key moving averages, currently sitting at around $0.00000443. Immediate resistance is noted between $0.00000447 and $0.00000457, with a more substantial barrier near $0.00000490. Meanwhile, the key long-term moving average is still much higher at $0.000577.
Technical momentum indicators such as the Relative Strength Index (RSI) hover near 44, which points to weak momentum rather than suggesting the onset of a bullish breakout.
Market Dynamics and Real Demand
While reduced reserves and net outflows may improve the supply landscape for SHIB, actual demand in the market remains crucial. The current bearish structure is expected to persist unless the token is able to turn these improved flow metrics into a sustained move above the $0.00000457–$0.00000490 range.
Despite potential long-term benefits from declining exchange reserves and positive net outflows, analysts point out that without a clear increase in demand and price momentum, these factors alone are not enough to reverse the current downward trend in SHIB.
Against the backdrop of these technical dynamics, traditional and crypto markets continue to converge on new solutions. While price action and capital flows remain under scrutiny, a broader shift is underway as Wall Street embraces Web3.
Until SHIB overcomes immediate technical resistance and shows consistent demand, any potential upside from exchange outflows and declining reserves will likely remain limited.
0
0
Disclaimer: The content of this article solely reflects the author's opinion and does not represent the platform in any capacity. This article is not intended to serve as a reference for making investment decisions.
Understand the market, then trade.
Bitget offers one-stop trading for cryptocurrencies, stocks, and gold.
Trade now!
You may also like
Silver Price Forecast: XAG/USD trades flat around $66.60 ahead of US data
FXStreet•2026/09/01 03:18
Nvidia is the central bank of the AI supply chain — How deep is the moat built by Jensen Huang?
Gavin Baker believes that Nvidia, through vertically integrating its supply chain, securing wafer capacity from TSMC and global critical component supply, and building a financeable data center ecosystem, has become the "central bank" of the AI supply chain, with a moat that is extremely difficult to replicate. Nvidia’s residual value guarantee mechanism allows its data centers to be financed with low equity ratios, attracting institutions such as Blackstone and KKR to participate, while competing products like TPU face significantly higher financing costs.
华尔街见闻•2026/09/01 03:16
Crypto prices
More
Bitcoin
BTC
$78,429.44
+0.99%

Ethereum
ETH
$2,464.52
+2.05%

Tether USDt
USDT
$0.9997
-0.01%

BNB
BNB
$692.52
+1.19%

XRP
XRP
$1.38
+1.86%

USDC
USDC
$0.9999
+0.00%

Solana
SOL
$103.35
+1.58%

TRON
TRX
$0.3321
-1.24%

Hyperliquid
HYPE
$83.91
+4.52%

Zcash
ZEC
$853.1
+4.44%
How to buy BTC
Bitget lists BTC – Buy or sell BTC quickly on Bitget!
Trade now
Become a trader now?A welcome pack worth 6200 USDT for new users!
Sign up now