
Ryanair Stock Pinned Below Key Averages as Quarterly Profit Sinks 34%

Ryanair Stock remains in a controlled downtrend, with RYAAY closing the 11 August session at 59.37. The price sits below its 20-, 50- and 200-period exponential moving averages. With resistance stacked at 60.25, 60.65 and 61.46, the burden of proof rests firmly with buyers.
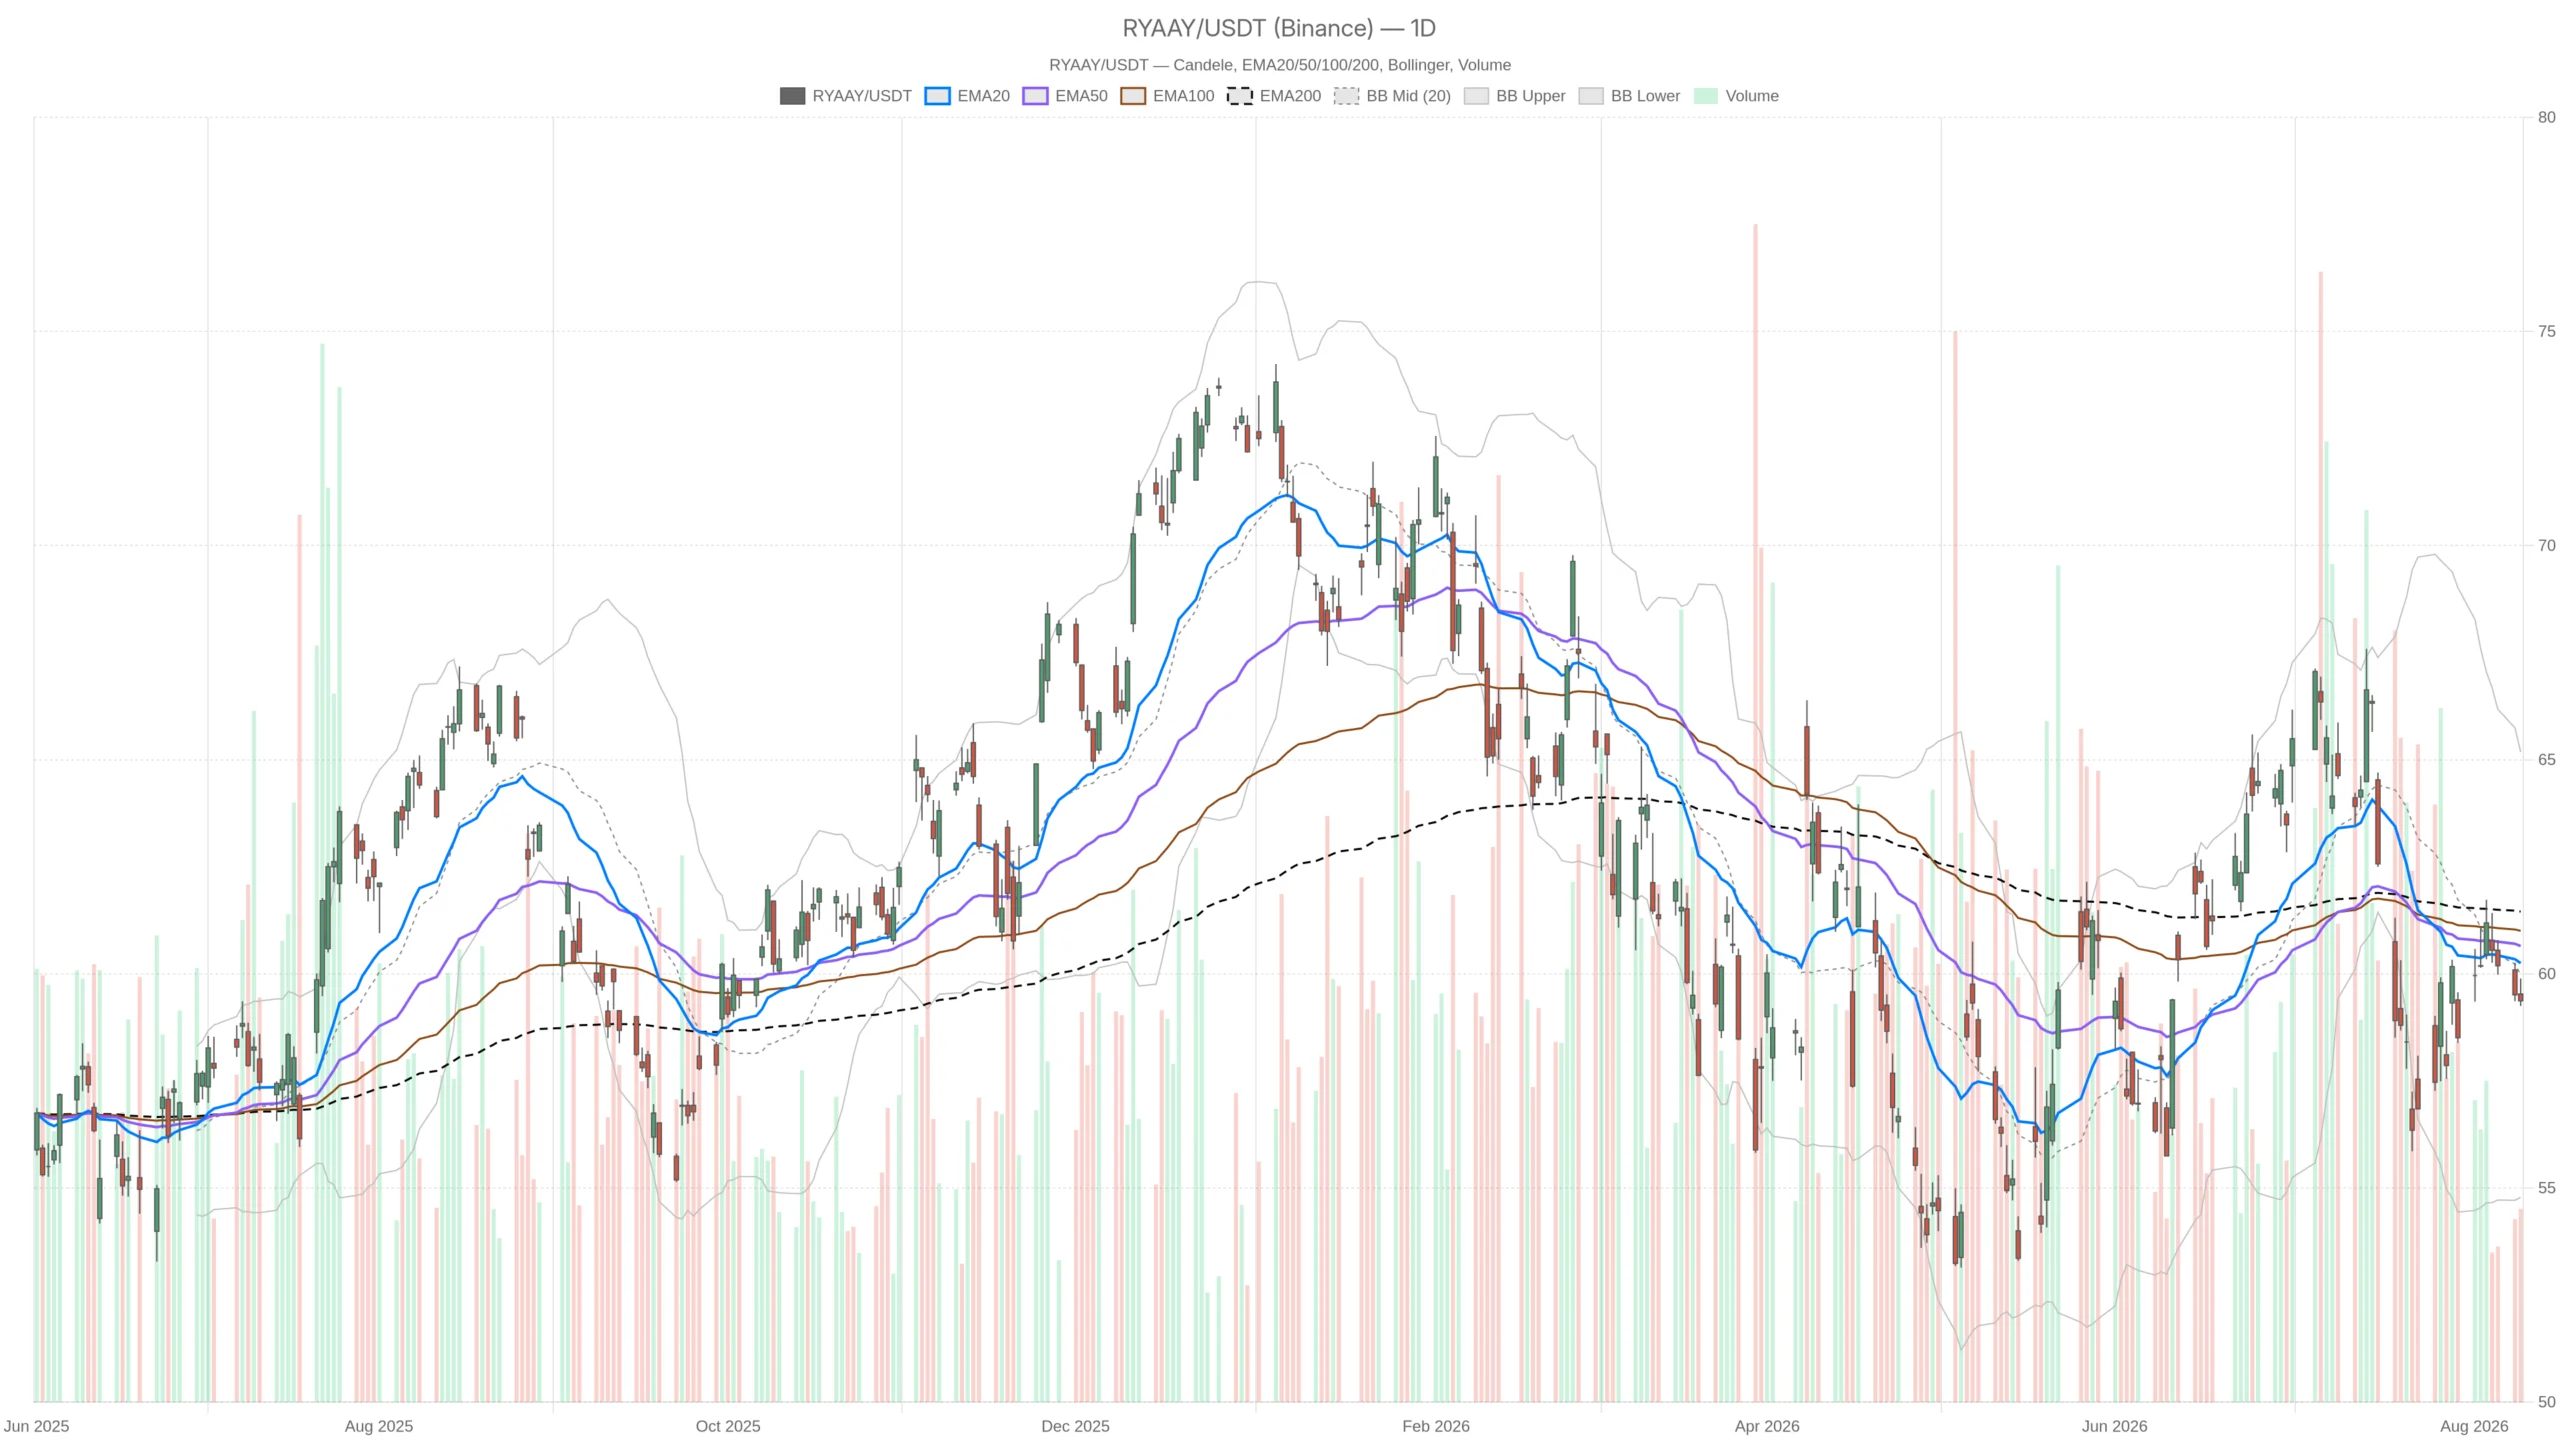 RYAAY — daily chart with candlesticks, EMA20/EMA50 and volume.
Summary
- Key takeaways
- Why the Daily Chart Still Sets a Bearish Bias for Ryanair Stock
- The Fundamental Backdrop Behind the Weakness
- The 1H Chart Confirms Rather Than Challenges
- 15m Execution Context: Coiled and Directionless
- Bullish Scenario for Ryanair Stock
- Bearish Scenario for Ryanair Stock
- Positioning and Uncertainty
- FAQ
Key takeaways
- RYAAY closed at 59.37 on 11 August, pinned below all three key EMAs — the 20-period at 60.25, 50-period at 60.65 and 200-period at 61.46.
- Daily RSI sits at 46.1, soft but not oversold, while the MACD histogram has turned mildly positive at 0.08.
- Quarterly PAT fell 34% to €593 million as unhedged jet fuel costs spiked and average fares dropped 6%.
- Hourly RSI reads 37.81 — the weakest across all three timeframes — reinforcing the bearish intraday structure.
- All three timeframes (daily, 1H, 15m) are aligned bearish, with no cross-timeframe conflict to support a reversal case.
Why the Daily Chart Still Sets a Bearish Bias for Ryanair Stock
Ryanair Stock carries a bearish bias because it trades below all three key exponential moving averages. Range compression under that resistance signals hesitation rather than accumulation.
The daily candle itself was tight: open 59.53, high 59.89, low 59.25, close 59.37. Range compression of that kind under falling moving averages usually reflects hesitation, not accumulation. Volume of 601,675 shares adds nothing dramatic to the picture.
Bollinger Bands reinforce that reading. The daily midline sits at 59.98, with the upper band at 65.18 and the lower at 54.78. Price is hugging the underside of the mean, which is classic behaviour in a downtrend that has paused. Notably, the bands remain wide, so the market has not yet entered a genuine squeeze phase.
Meanwhile, daily ATR of 1.69 frames the practical expectations. That is the volatility budget a position must tolerate over a session. Against a 59.37 close, it implies roughly a three percent daily swing potential. That is meaningful for anyone working with tight stops.
Pivot levels tighten the near-term map. The daily pivot sits at 59.50, with R1 at 59.76 and S1 at 59.12. Price closed just under the pivot, so the immediate battle is narrow and technical rather than directional.
The Fundamental Backdrop Behind the Weakness
The fundamental driver behind Ryanair Stock’s weakness is margin compression. Quarterly PAT fell 34% to €593 million as fuel costs rose and fares declined.
The technical damage has a clear fundamental echo. Ryanair reported a difficult start to its fiscal year, with quarterly PAT falling 34% to €593 million (£503 million). The cause was twofold: the price of its 20% unhedged jet fuel spiked, and fares fell 6%.
Revenue still edged 1% higher to €4.4 billion, which speaks to volume resilience rather than pricing power. Meanwhile, the sector-wide fuel cost problem is being framed as a comparative question. Commentary weighs American Airlines against Ryanair on how each absorbs the pressure. For the chart, the takeaway is simple. A margin story, not a demand story, is capping rallies in Ryanair Stock.
The 1H Chart Confirms Rather Than Challenges
The hourly chart reinforces the bearish outlook for Ryanair Stock. RYAAY remains pinned beneath the same descending EMA alignment visible on the daily timeframe.
Intraday structure agrees with the daily bias, and that matters. The hourly close of 59.40 sits beneath EMA20 at 59.76, EMA50 at 59.92 and EMA200 at 60.53. The same descending alignment appears one timeframe down, which removes the usual excuse of a short-term countertrend bounce.
Hourly RSI at 37.81 is the weakest reading across the three timeframes. It is approaching stretched territory without confirming it. On the other hand, the hourly MACD histogram is mildly negative at -0.03. The line sits at -0.26, below its -0.23 signal. Momentum on this horizon is still leaking lower.
Hourly Bollinger Bands span 59.04 to 60.56 around a 59.80 midline. Price is in the lower half, and the 59.04 band lines up reasonably with the daily S1 at 59.12. That cluster is the first genuine test if sellers press again. Hourly ATR of 0.29 shows intraday movement is orderly, not panicked.
15m Execution Context: Coiled and Directionless
The 15-minute chart shows Ryanair Stock in a low-volatility compression. Bollinger Bands are narrowing between 59.28 and 59.60 as the market awaits a directional breakout.
On the 15-minute chart, the market is barely breathing. The final candle spanned 59.32 to 59.43 and closed flat at 59.40. Bollinger Bands are compressed between 59.28 and 59.60, with ATR at just 0.10.
Short-term moving averages remain layered above price, at 59.46, 59.63 and 59.85. RSI is the most neutral of the set at 44.52, and MACD is effectively flat with a 0.01 histogram. In practice, this is a coiled, low-volatility base inside a bearish structure. Such setups tend to resolve with an expansion move, and the prevailing trend usually gets the benefit of the doubt.
Bullish Scenario for Ryanair Stock
A bullish reversal depends on reclaiming the daily pivot at 59.50 and R1 at 59.76 in sequence. Sustained trade above the daily EMA20 at 60.25 would serve as the credibility test.
Buyers do have a case, but it needs to be earned in stages. The first requirement is reclaiming the daily pivot at 59.50 and then R1 at 59.76. That level is also the hourly EMA20. A push through the hourly EMA50 at 59.92 and the daily Bollinger midline at 59.98 would follow.
Above that, the 60.25 daily EMA20 becomes the credibility test. Sustained trade above it, ideally with the daily MACD histogram continuing to improve, would shift the tone from bearish to neutral. Only a move toward 60.65 and eventually 61.46 would seriously threaten the downtrend. Improving RSI from 46.1 without an immediate rejection would strengthen that argument.
Bearish Scenario for Ryanair Stock
The bearish case needs no new catalyst. A break below daily S1 at 59.12 would confirm continuation, especially if combined with a loss of the 59.04 hourly lower band.
The bearish case is simpler because it requires nothing new. A break below daily S1 at 59.12 would confirm continuation. That needs to coincide with a loss of the 59.04 hourly lower band. Below that zone, the daily lower band at 54.78 becomes the extreme reference. Nothing in current volatility suggests a fast path there, however.
Any rejection at the 59.76 to 60.25 band would invalidate the bullish thesis before it starts. Equally, a fresh downturn in the daily MACD histogram would remove the only constructive signal currently on the higher timeframe.
Positioning and Uncertainty
Ryanair Stock sits in a bearish regime that has temporarily exhausted momentum on both sides. All three timeframes are aligned bearish despite mild positive drift in daily momentum.
Overall, the evidence points to a market in a bearish regime that has temporarily run out of momentum on both sides. All three timeframes are labelled bearish, so there is no genuine cross-timeframe conflict here. The only nuance is the mild positive drift in daily momentum against continued hourly weakness.
Volatility is the key variable. With 15-minute ATR at 0.10 and daily ATR at 1.69, the gap is wide. It separates current stillness from the normal daily range. That asymmetry argues for patience until price commits beyond 59.76 on the upside or 59.12 on the downside. Until then, Ryanair Stock remains a trend-respecting chart in a compression phase. Fuel costs and fare weakness still shape the risk narrative.
FAQ
What is the current trend for Ryanair Stock?
Ryanair Stock is in a controlled bearish downtrend. RYAAY closed at 59.37 on 11 August, below its 20-, 50- and 200-period exponential moving averages. All three timeframes — daily, hourly and 15-minute — are aligned bearish, with no cross-timeframe conflict to challenge the downtrend.
What are the key resistance levels for RYAAY?
The three key EMAs form immediate resistance at 60.25 (20-period), 60.65 (50-period) and 61.46 (200-period). The daily pivot sits at 59.50, with R1 at 59.76. A credible bullish reversal would require reclaiming these levels in sequence, with the daily EMA20 at 60.25 serving as the pivotal credibility test.
What fundamental factors are weighing on Ryanair Stock?
Ryanair reported quarterly PAT falling 34% to €593 million, driven by a spike in unhedged jet fuel costs and a 6% decline in average fares. Revenue still edged 1% higher to €4.4 billion, pointing to volume resilience rather than pricing power. A margin compression story, not a demand collapse, is capping rallies.
What levels should traders watch for a breakout?
Key levels are 59.76 on the upside — which coincides with daily R1 and the hourly EMA20 — and 59.12 on the downside, which aligns with daily S1 and sits near the hourly lower Bollinger band at 59.04. A sustained move beyond either level would signal the next directional expansion.
{"@context":"https://schema.org","@type":"FAQPage","mainEntity":[{"@type":"Question","name":"What is the current trend for Ryanair Stock?","acceptedAnswer":{"@type":"Answer","text":"Ryanair Stock is in a controlled bearish downtrend. RYAAY closed at 59.37 on 11 August, below its 20-, 50- and 200-period exponential moving averages. All three timeframes — daily, hourly and 15-minute — are aligned bearish, with no cross-timeframe conflict to challenge the downtrend."}},{"@type":"Question","name":"What are the key resistance levels for RYAAY?","acceptedAnswer":{"@type":"Answer","text":"The three key EMAs form immediate resistance at 60.25 (20-period), 60.65 (50-period) and 61.46 (200-period). The daily pivot sits at 59.50, with R1 at 59.76. A credible bullish reversal would require reclaiming these levels in sequence, with the daily EMA20 at 60.25 serving as the pivotal credibility test."}},{"@type":"Question","name":"What fundamental factors are weighing on Ryanair Stock?","acceptedAnswer":{"@type":"Answer","text":"Ryanair reported quarterly PAT falling 34% to €593 million, driven by a spike in unhedged jet fuel costs and a 6% decline in average fares. Revenue still edged 1% higher to €4.4 billion, pointing to volume resilience rather than pricing power. A margin compression story, not a demand collapse, is capping rallies."}},{"@type":"Question","name":"What levels should traders watch for a breakout?","acceptedAnswer":{"@type":"Answer","text":"Key levels are 59.76 on the upside — which coincides with daily R1 and the hourly EMA20 — and 59.12 on the downside, which aligns with daily S1 and sits near the hourly lower Bollinger band at 59.04. A sustained move beyond either level would signal the next directional expansion."}}]}
Article produced with the assistance of artificial intelligence and reviewed by the editorial team.
Disclaimer: The content of this article solely reflects the author's opinion and does not represent the platform in any capacity. This article is not intended to serve as a reference for making investment decisions.
You may also like

Goldman Sachs Issues "Neutral" Signal for Tesla (TSLA.US): Cybercab's Cost Advantage Is Significant, but Software Scalability Is Key to Valuation
Goldman Sachs recently released a research report on Tesla (TSLA.US), maintaining a "Neutral" rating with a 12-month target price of $360.

US Dollar Index (DXY) struggles below 99.00, two-week low as traders eye US inflation data

Crypto prices
More


