
Walt Disney Company stock stays bearish below key EMAs before August 5 earnings

Walt Disney Company stock closed Thursday at $96.19, trapped below all three key daily moving averages. The EMA stack remains bearish, with DIS trading below its 20-day, 50-day, and 200-day EMAs. Short-term stabilization is visible, but the broader trend has not turned.
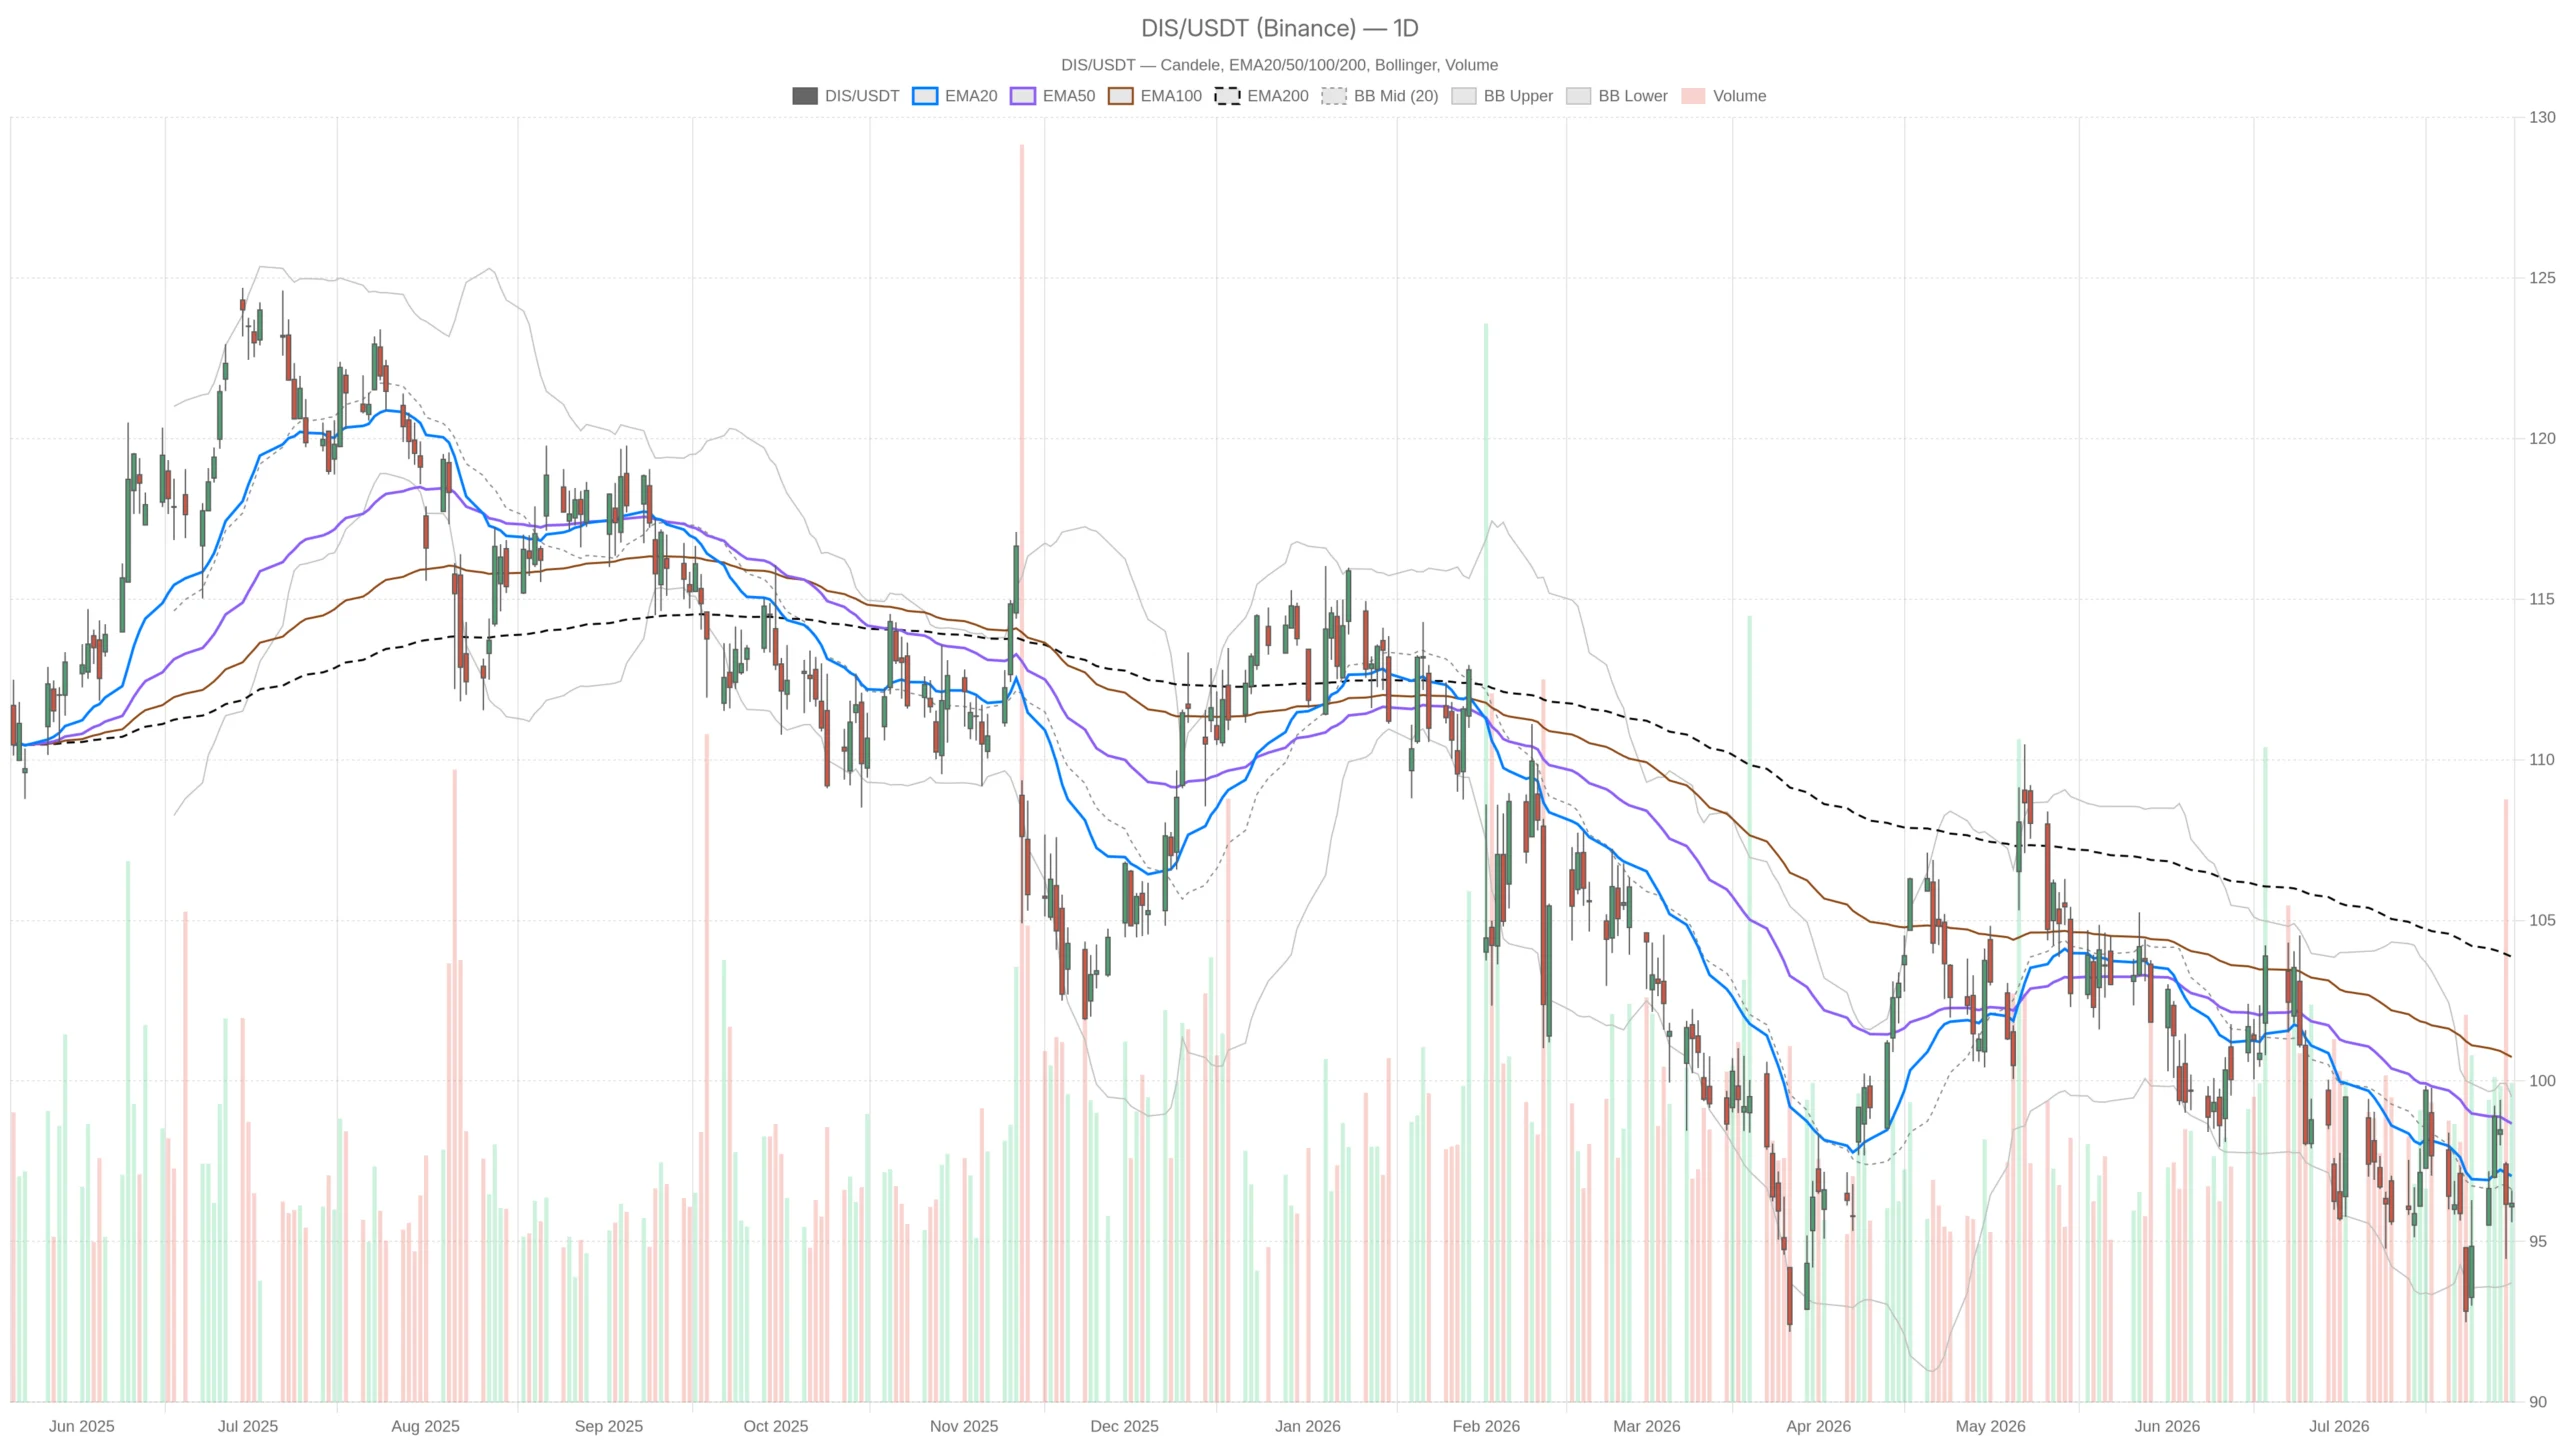 DIS — daily chart with candlesticks, EMA20/EMA50 and volume.
Summary
Key takeaways
- Walt Disney Company stock closed at $96.19, below its 20-day EMA ($97.04), 50-day EMA ($98.67), and 200-day EMA ($103.87), confirming a bearish EMA stack.
- The daily MACD histogram has turned positive at 0.23, suggesting bearish momentum is fading, though the overall MACD structure remains bearish.
- Disney reports quarterly earnings on August 5, alongside the expected closing of its A+E Networks stake sale to Hearst for more than $1 billion.
- Daily ATR14 at 2.31 signals elevated volatility, making the stock vulnerable to sharp moves around the upcoming catalysts.
- Key levels to watch: daily pivot at $96.13, R1 resistance at $96.65, and S1 support at $95.66.
The daily RSI at 46.34 sits just below the neutral 50 line. This tells a story of fading downside momentum rather than aggressive selling. It is not oversold and is not signaling a bounce on its own. Meanwhile, the MACD picture is more nuanced. The MACD line at -0.69 remains below the signal line at -0.92. This keeps the indicator in bearish territory overall.
However, the histogram has turned positive at 0.23. This suggests the bearish momentum that drove the recent decline is losing steam. It is a subtle but meaningful shift. It is also the kind of early divergence traders watch for before a potential base forms.
Daily structure and volatility context for DIS stock
The daily structure for Walt Disney Company stock reflects a compressed, indecisive zone rather than a decisive trend. Bollinger Bands place the mid-line at $96.61, with the upper band at $99.50 and the lower band at $93.72. Price sits just below the mid-line, reinforcing the picture of compression.
The daily ATR14 reading of 2.31 shows volatility remains elevated relative to recent ranges. This matters heading into a heavy news week. Daily pivot levels frame the near-term battle clearly. The pivot point sits at $96.13. Resistance R1 stands at $96.65 and support S1 at $95.66. Thursday’s close near $96.19 puts price right on top of that pivot, essentially at a decision point.
Turning to the 1-hour chart, the picture largely confirms the daily bearish bias. Price at $96.22 remains below the 1H EMA20 ($96.51), EMA50 ($96.65), and EMA200 ($97.54). The 1H regime is also labeled bearish. The 1H RSI at 45.8 mirrors the daily reading, hovering just under neutral.
More telling is the 1H MACD. The line at -0.28 sits below the signal at -0.23. The histogram is negative at -0.04. Unlike the daily histogram, momentum here has not yet turned. In other words, the near-term trend is still soft. The daily and hourly timeframes are aligned on the bearish side, even if the daily histogram hints at an early attempt to stabilize.
Short-term execution view on the 15-minute chart
On the shorter timeframe, the 15-minute chart shows DIS stock consolidating in a tight range with no clear directional conviction. Price at $96.22 is above its 15m EMA20 ($96.18). However, it remains below the EMA50 ($96.34) and EMA200 ($96.75). The regime is labeled neutral, which fits the mixed EMA positioning.
RSI at 51.15 sits right at the midpoint. The MACD line at 0.03 has crossed marginally above its signal at 0.01. This produces a small positive histogram of 0.02. None of this changes the broader bias, but it does suggest short-term buyers are testing the waters near the pivot.
The 15m pivot at $96.26 with resistance at $96.35 and support at $96.12 shows price is essentially pinned in a tight band. This is consistent with the low ATR14 reading of 0.20 on this timeframe. Overall, the short-term tape looks like consolidation rather than conviction in either direction.
Notably, context from the news flow adds weight to this technical setup. Disney reports its quarterly financial update on August 5, a date multiple outlets have flagged as pivotal for the stock. Alongside that release, Disney is finalizing the sale of its A+E Networks 50% stake to Hearst for more than $1 billion. The deal is expected to close around the same time as earnings.
Wall Street commentary has described Disney stock as sluggish of late. Still, some analysts remain optimistic despite what one report called significant challenges under new leadership. These are notable near-term catalysts. They could easily override short-term technical patterns once the numbers land.
Bullish scenario for Disney stock
For a genuine bullish case to develop, Walt Disney Company stock would need to reclaim the daily EMA20 near $97.04. It would also need to push through daily R1 resistance at $96.65. A move like that, especially if paired with a positive earnings surprise on August 5, could shift sentiment quickly.
For confirmation, the daily MACD histogram would need to continue expanding. Eventually, the MACD line would need to cross above the signal line. On the hourly chart, a sustained break above the EMA50 at $96.65 and EMA200 at $97.54 would be required. That would validate that the bearish regime has genuinely flipped, rather than just cooling off temporarily.
Bearish scenario and invalidation levels
The bearish case for Disney stock remains intact as long as price stays capped below the daily pivot cluster. A rejection near $96.65 followed by a break of daily S1 at $95.66 would open the door toward the lower Bollinger Band at $93.72. It would also highlight how far DIS has fallen below its 200-day EMA at $103.87.
On the hourly chart, continued trading below the EMA20, EMA50, and EMA200 would reinforce near-term seller control. A negative earnings reaction on August 5 would likely accelerate that move. This is especially true given the stock’s already sluggish characterization in recent coverage.
Overall, Walt Disney Company stock is caught between a daily downtrend showing early signs of losing momentum and an hourly trend that has not confirmed any reversal. The 15-minute chart’s neutral tilt reflects a market pausing rather than committing. This is understandable given the concentration of catalysts around August 5.
Positioning ahead of that date carries real uncertainty. With daily ATR still running at 2.31, volatility around the earnings release and the A+E divestiture could be sharp in either direction. Traders following Disney stock closely should treat current levels as a decision zone, not a settled trend. The pivot points and moving averages outlined above serve as the key markers to watch in the sessions ahead.
FAQ
What is the current trend for Walt Disney Company (The) stock?
DIS stock is in a bearish trend, trading below its 20-day EMA ($97.04), 50-day EMA ($98.67), and 200-day EMA ($103.87). The daily regime reading confirms bearish, though short-term momentum shows early signs of stabilizing.
What are the key levels to watch for Disney stock?
The daily pivot sits at $96.13, with R1 resistance at $96.65 and S1 support at $95.66. The lower Bollinger Band at $93.72 serves as the next downside target if S1 breaks. On the upside, the 20-day EMA at $97.04 is the first key resistance.
When does Walt Disney Company report earnings?
Disney reports its quarterly financial update on August 5, a date flagged by multiple outlets as pivotal for the stock. The A+E Networks stake sale to Hearst is also expected to close around the same time.
What does the MACD indicate for DIS stock?
The daily MACD line at -0.69 remains below the signal line at -0.92, keeping the indicator in bearish territory. However, the histogram has turned positive at 0.23, suggesting bearish momentum is losing steam and a potential base may be forming.
{"@context":"","@type":"FAQPage","mainEntity":[{"@type":"Question","name":"What is the current trend for Walt Disney Company (The) stock?","acceptedAnswer":{"@type":"Answer","text":"DIS stock is in a bearish trend, trading below its 20-day EMA ($97.04), 50-day EMA ($98.67), and 200-day EMA ($103.87). The daily regime reading confirms bearish, though short-term momentum shows early signs of stabilizing."}},{"@type":"Question","name":"What are the key levels to watch for Disney stock?","acceptedAnswer":{"@type":"Answer","text":"The daily pivot sits at $96.13, with R1 resistance at $96.65 and S1 support at $95.66. The lower Bollinger Band at $93.72 serves as the next downside target if S1 breaks. On the upside, the 20-day EMA at $97.04 is the first key resistance."}},{"@type":"Question","name":"When does Walt Disney Company report earnings?","acceptedAnswer":{"@type":"Answer","text":"Disney reports its quarterly financial update on August 5, a date flagged by multiple outlets as pivotal for the stock. The A+E Networks stake sale to Hearst is also expected to close around the same time."}},{"@type":"Question","name":"What does the MACD indicate for DIS stock?","acceptedAnswer":{"@type":"Answer","text":"The daily MACD line at -0.69 remains below the signal line at -0.92, keeping the indicator in bearish territory. However, the histogram has turned positive at 0.23, suggesting bearish momentum is losing steam and a potential base may be forming."}}]}
Article produced with the assistance of artificial intelligence and reviewed by the editorial team.
Disclaimer: The content of this article solely reflects the author's opinion and does not represent the platform in any capacity. This article is not intended to serve as a reference for making investment decisions.
You may also like
Goldman Sachs says the most capital-hungry investment cycle in history has arrived
Why is Berkshire Hathaway stock rallying today?
Strategy to increase Bitcoin sales to $5B – Will the 4X selling pressure affect BTC?

STRK Whale Sale Fuels Market Caution

Crypto prices
More


