


Solana is holding a key support zone that could decide whether the recovery continues or breaks down. A move above $82-$85 would strengthen the setup and put $94, $125 and eventually $143 back in focus.
Solana Holds $74 as Elliott Wave Setup Targets $82-$94
Solana is trying to hold the 38.2% Fibonacci support near $74 after pulling back from the $82 area. A confirmed rebound could restart the recovery toward $79-$82, with higher targets near $89-$94.
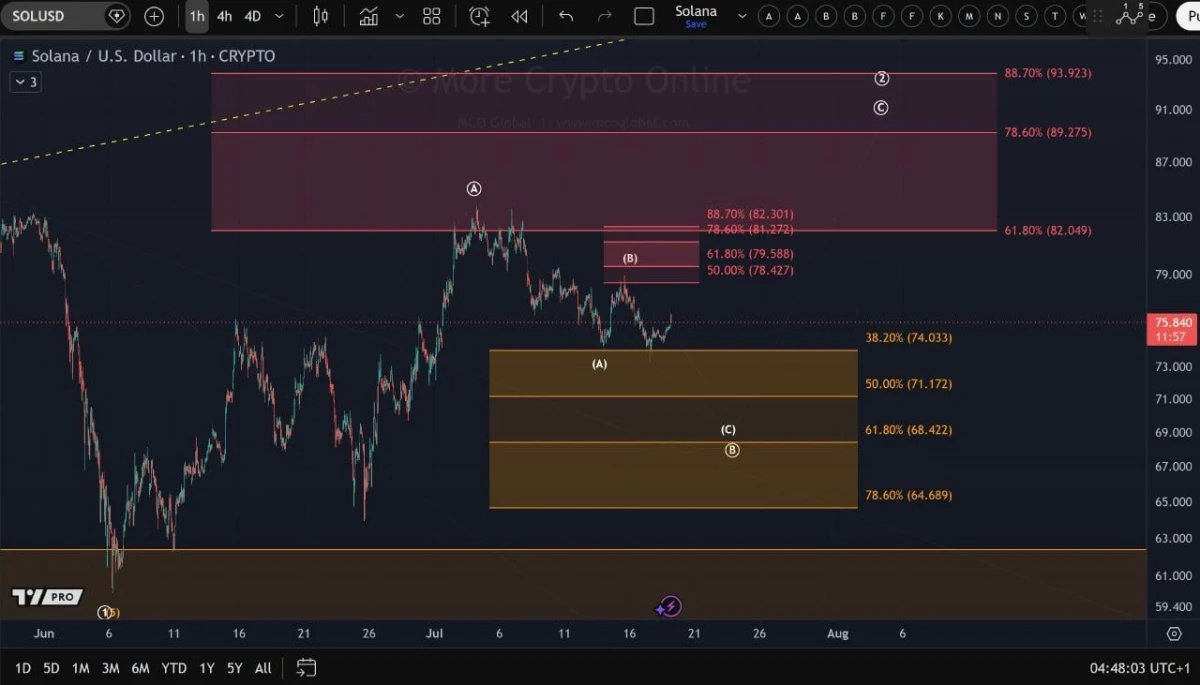
$SOL one-hour chart. Source: More Crypto Online/X
The chart presents two possible Elliott Wave paths. In the bullish scenario, $SOL has completed a corrective pullback near $74 and is preparing for another move higher.
The first resistance zone sits between roughly $78.40 and $82.30. Breaking and holding above that area would improve the short-term structure and support an extension toward $89.30-$93.90.
However, the support test remains unresolved. A clean break below $74 could deepen the correction toward $71.17, followed by $68.42 and the larger support near $64.69.
For now, $74 is the main decision level. Holding it keeps the bullish wave count active, while losing it would suggest Solana needs a deeper reset before another recovery attempt.
Solana Holds $75 Support as $125 Target Comes Into View
Solana is defending a major weekly support area near $75 after months of selling pressure. A sustained rebound could expose a thin trading zone toward $125, although several moving averages still stand in the way.
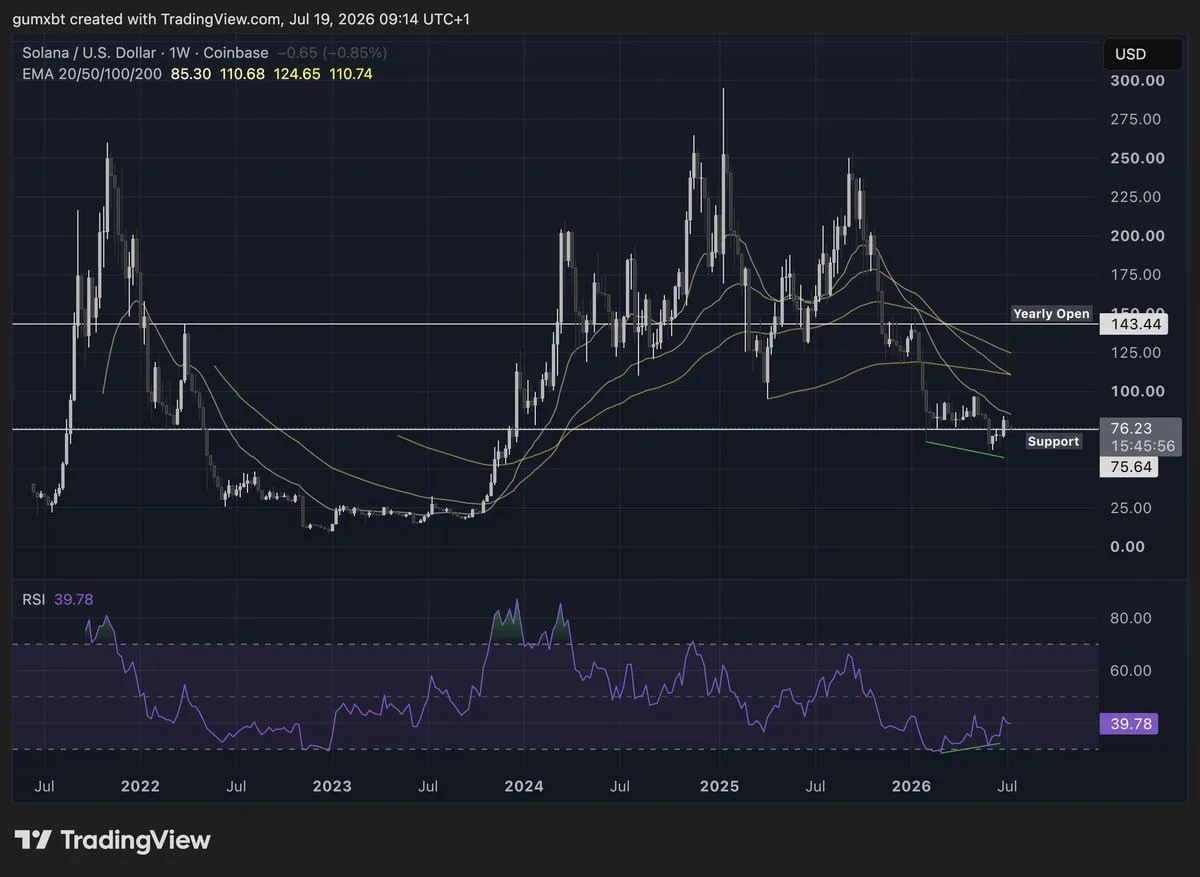
$SOL weekly chart. Source: Gum/X
The chart shows $SOL holding the same broad area that previously launched a rapid move toward $140. Because price moved quickly through the $75-$125 range in earlier cycles, the region contains limited historical support and resistance.
The first challenge sits near the 20-week exponential moving average around $85. Reclaiming it would improve short-term momentum, but $SOL would still face a larger resistance cluster around $110-$125, where the longer moving averages are grouped.
Weekly RSI is also forming higher lows while price remains close to support. This bullish divergence suggests downside momentum may be weakening, although buyers still need to confirm it with stronger weekly closes.
A clean break above $125 could open the way toward the yearly open near $143. However, the setup would weaken if Solana loses the $75 support area, which could expose the lower trendline and restart the broader decline.


