
A Chart of Commodity Support and Resistance: Gold, Silver, Oil, Gas + Platinum, Palladium, Copper, Agricultural Futures (June 30, 2026)

FX678 June 30—— A single chart visualizing commodity support and resistance: gold, silver, oil, gas, platinum, palladium, copper, and agricultural futures, updated on Tuesday, June 30, 2026, 07:00 (UTC+8). Specifically covering 14 varieties including gold, silver, platinum, palladium, copper, crude oil, natural gas, fuel oil, wheat, corn, and cotton. For more details, refer to the FX678's custom chart.
A chart visualizing commodity support and resistance: gold, silver, oil, gas, platinum, palladium, copper, and agricultural futures, updated on Tuesday, June 30, 2026, 07:00 (UTC+8). Specifically covering 14 varieties including gold, silver, platinum, palladium, copper, crude oil, natural gas, fuel oil, wheat, corn, and cotton. For more details, see the content in the specially-made FX678 chart.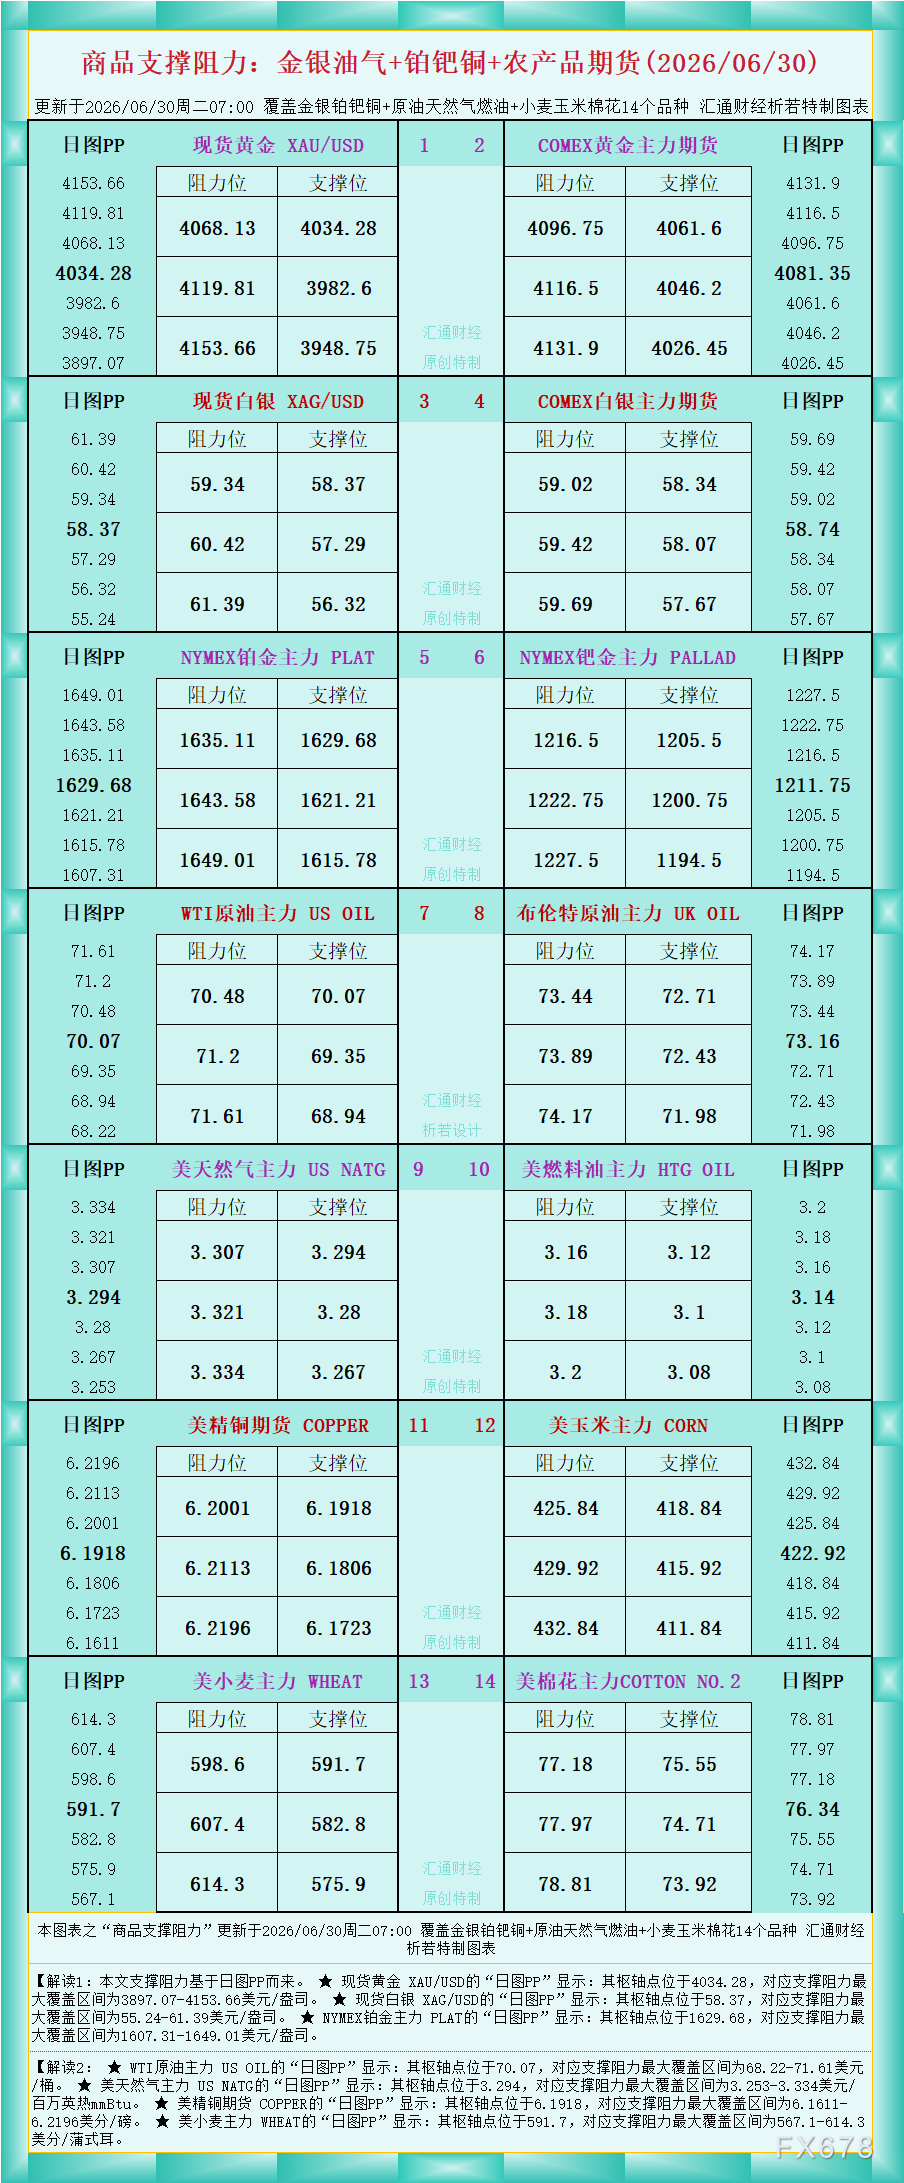
As shown in the figure, Interpretation 1: The support and resistance levels in this article are based on the daily chart pivot points (PP).
★ For spot gold XAU/USD, the “Daily Chart PP” shows: the pivot point is at 4034.28, with the maximum support and resistance range covering $3897.07-$4153.66/oz.
★ For spot silver XAG/USD, the “Daily Chart PP” shows: the pivot point is at 58.37, with the maximum support and resistance range covering $55.24-$61.39/oz.
★ For NYMEX platinum main contract PLAT, the “Daily Chart PP” shows: the pivot point is at 1629.68, with the maximum support and resistance range covering $1607.31-$1649.01/oz.
Interpretation 2:
★ For WTI Crude Oil main contract US OIL, the “Daily Chart PP” shows: the pivot point is at 70.07, with the maximum support and resistance range covering $68.22-$71.61/barrel.
★ For US natural gas main contract US NATG, the “Daily Chart PP” shows: the pivot point is at 3.294, with the maximum support and resistance range covering $3.253-$3.334/MMBtu.
★ For US copper futures COPPER, the “Daily Chart PP” shows: the pivot point is at 6.1918, with the maximum support and resistance range covering 6.1611-6.2196 cents/pound.
★ For US wheat main contract WHEAT, the “Daily Chart PP” shows: the pivot point is at 591.7, with the maximum support and resistance range covering 567.1-614.3 cents/bushel.
For more variety interpretations, refer to the chart. Produced originally and exclusively by FX678. All rights reserved.
Disclaimer: The content of this article solely reflects the author's opinion and does not represent the platform in any capacity. This article is not intended to serve as a reference for making investment decisions.
You may also like

XRP wallets holding 1 million or more classified as ‘Whale Territory’ in updated rankings
Metaplanet slides 17% this week as CEO's public note fails to ease investor concerns
Liquid Network gets 3,400 Bitcoin back: Attackers keep 15% as unofficial bounty
Crypto prices
More


