
Bitcoin Traders Split As BTC Holds $60K–$63.7K Support While

TL;DR
- TradingView analysts are watching whether Bitcoin can hold the $60,000–$63,700 support region.
- Bullish setups point to a recovery toward $67,000 and potentially higher if buyers defend demand.
- Bearish setups warn that losing $60,000 could open the door to a deeper breakdown.
Bitcoin Sits Between Recovery And Breakdown Setups
Bitcoin is entering the weekend with analysts split over whether the recent bounce is the start of a stronger recovery or only a pause before another leg lower. Several TradingView charts shared on June 20 focused on the same broad area: BTC is still reacting around the low-$60,000 region, but the next move depends heavily on whether buyers can continue to defend demand.
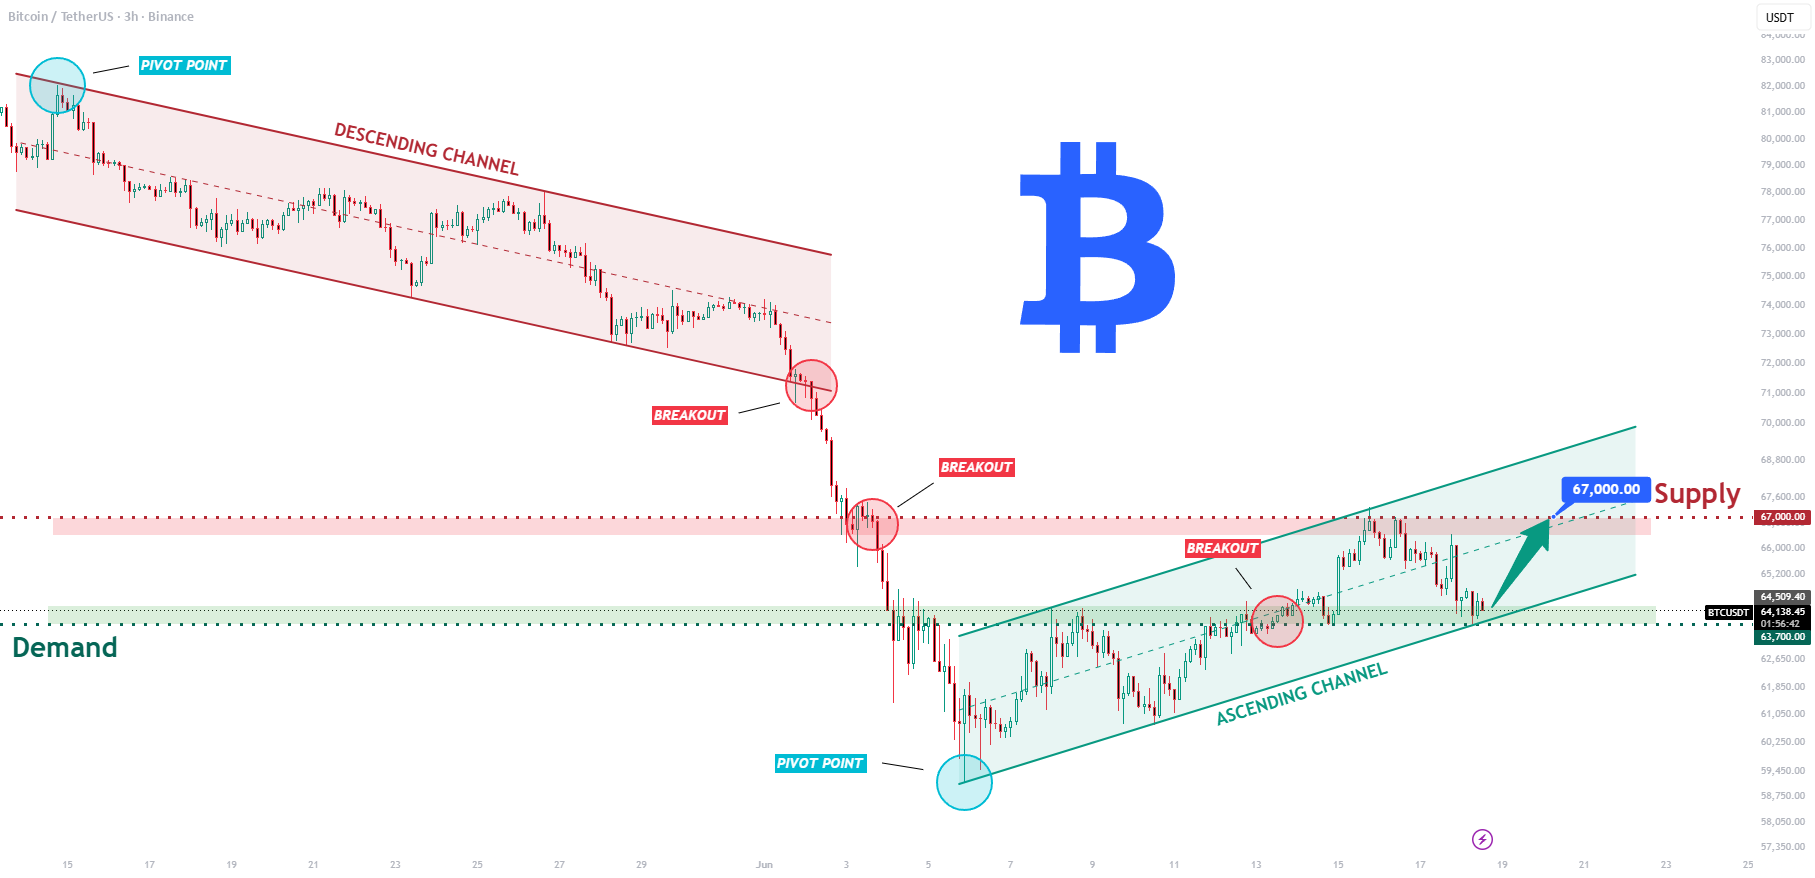
The more constructive case comes from heniitrading, who mapped BTCUSDT as having bounced from channel support after a previous break above resistance. In that setup, the market is holding above a $63,700 demand zone while still trading below a $67,000 supply zone. That leaves bulls with a clear short-term objective: push Bitcoin back into the upper area and prove that the recent buying pressure is not simply a weak relief move.
The $60,000 Line Remains The Bigger Test
Other analysts were less forgiving. Weslad described Bitcoin as sitting on a fresh demand zone, with $60,000 acting as the major line in the sand. The argument is straightforward: as long as the market respects that area, a recovery toward higher liquidity and supply zones remains possible. But a decisive close below $60,000 would weaken the bullish case and expose the market to a more serious downside extension.
That view broadly overlaps with behdark’s 4-hour BTCUSDT.P setup, which identified the $61,000 zone as the key reaction area. In that analysis, a strong response from buyers could support a move toward $72,000, while failure to hold the green support zone would keep a bearish wave structure in play and raise the probability of a slide toward $56,000.
What Traders Are Watching Next
The useful takeaway is not that one analyst has the final answer. It is that the market has a relatively clean decision zone. Bulls need to defend the low-$60,000 area and reclaim nearby resistance to keep the recovery structure alive. Bears need to force a breakdown below that same zone to turn the recent bounce into another failed reaction.
That makes the next few candles important for short-term traders. A push through $67,000 would strengthen the recovery argument, while a daily close below $60,000 would likely make the breakdown camp louder. Until then, Bitcoin remains stuck in a high-tension range where both sides have a technically credible case.
This report is based on information from TradingView heniitrading and TradingView weslad and TradingView behdark.
This article was written by the News Desk and edited by Samuel Rae.
This article is based on analysis shared on TradingView by heniitrading.
Disclaimer: The content of this article solely reflects the author's opinion and does not represent the platform in any capacity. This article is not intended to serve as a reference for making investment decisions.
You may also like
Gold falls below $4,400 as strong US jobs data raise the prospects for Fed rate hike
Dash price prediction 2026-2032: Is DASH recovering soon?
Following the rally in US tech stocks, South Korea’s KOSPI jumps 3%, SK Hynix surges nearly 6%, Kioxia rises 8%, and US-Iran oil tanker clashes drive oil prices higher
The current market is focused on two key issues: first, the escalating geopolitical risks in the Middle East, with maritime clashes between the US and Iran and the US hinting at possibly directly destroying Iran's nuclear capabilities, which has driven up oil prices and inflation concerns; second, the release of the US CPI data this Friday, which is expected to be decisive in determining whether the Federal Reserve will raise rates in September. Meanwhile, hawkish expectations from the Bank of Japan are reshaping the trajectory of the yen.
Crypto prices
More


