Bitget App
Trade smarter
Buy cryptoMarketsTradeFuturesStocksEarnInstitutionAI & More
XDC rally faces pressure – Could fading demand trigger a pullback?

XDC rally faces pressure – Could fading demand trigger a pullback?

CryptoNewsNetCryptoNewsNet2026/05/26 03:42
By:CryptoNewsNet
Back to the list

XDC rally faces pressure – Could fading demand trigger a pullback?

XDC rally faces pressure – Could fading demand trigger a pullback? image 0  ambcrypto.com 18 m
XDC rally faces pressure – Could fading demand trigger a pullback? image 1

$XDC Network [$XDC] has posted a double-digit gain of above 10% in the past 24 hours at press time, driven by a building spot foundation that preceded the surge.

Market analysis indicates that the rally was not spontaneous; four days of buying activity laid the groundwork for the price to rise. Despite this, the asset now sits at a critical edge as indicators show bulls beginning to exit the market.

How did $XDC’s price surge?

CoinGlass data showed that $363,830 was spent acquiring $XDC between the 21st and 24th of May, reflecting a period where investors were steadily accumulating the asset, likely viewing it as undervalued at those levels.
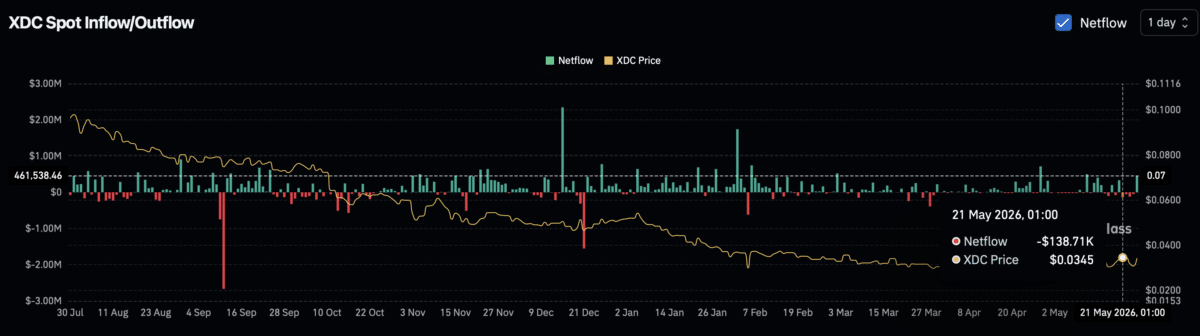
XDC rally faces pressure – Could fading demand trigger a pullback? image 2 Source: CoinGlass

While profit-taking has since begun in the spot market, perpetual traders have stepped in to add capital, with Open Interest (OI) climbing 9.97% to $4.8 million as of writing.

This activity has added further momentum to the ongoing accumulation that has benefited $XDC over the past 24 hours. However, with indicators now showing early signs of bulls scaling back, the asset faces growing pressure from both sides.

$XDC approaches the supply zone as accumulation fades

Clear pressure is building against $XDC as the asset approaches a territory that historically signals buyer exhaustion.

At the time of writing, $XDC was on the verge of hitting the upper Bollinger Band, the overvalued zone, which notably coincides with a supply zone on the chart. Whenever price approaches this level, it signals that buyers are becoming exhausted and increases the tendency for a decline.
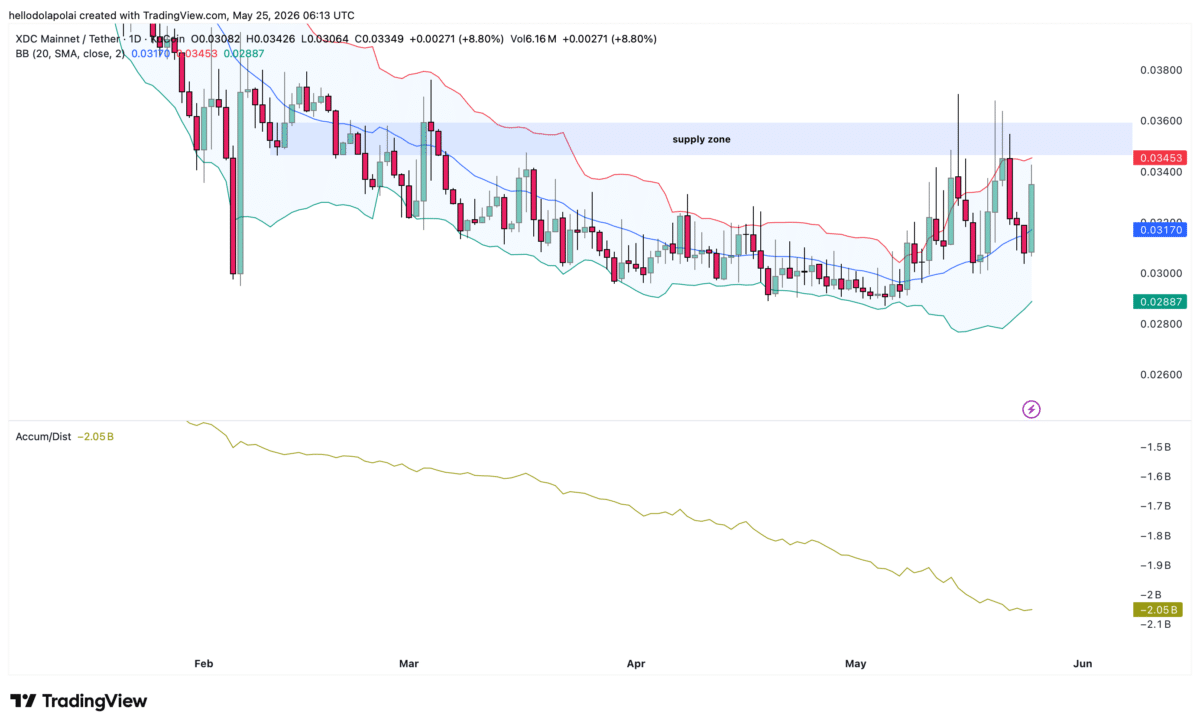
XDC rally faces pressure – Could fading demand trigger a pullback? image 3 Source: TradingView

The Accumulation/Distribution indicator compounded this reading as the A/D declined and then flattened, sitting at approximately -2.05 billion in accumulated volume.

This combination of price nearing full exhaustion alongside a fading A/D indicator suggests investors and traders are scaling back, and further capital outflows from $XDC appear increasingly likely.

Liquidity clusters sit below price

The liquidation heatmap reveals limited liquidity on the chart overall, with the clusters that do exist sitting predominantly below price rather than above it.

Liquidity clusters act as attraction points on the chart, drawing price toward them over time, and the current placement of clusters below price increases the probability of a move lower.
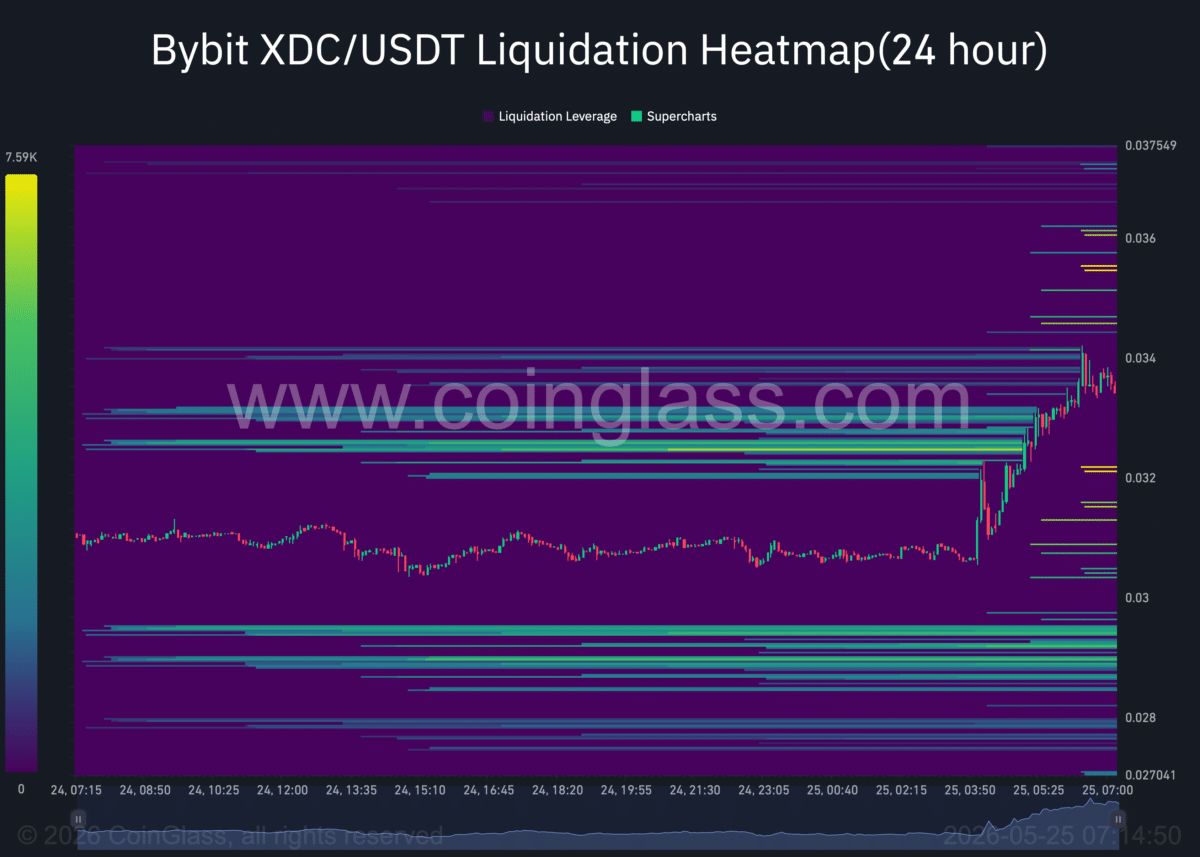
XDC rally faces pressure – Could fading demand trigger a pullback? image 4 Source: CoinGlass

Notably, this has yet to materialize as perpetual contracts remain tilted in favor of bulls, with the Funding Rate holding slightly positive at 0.0050%.

A shift in the Funding Rate turning negative would add to the exit pressure, as short contracts would begin to accumulate and weigh on price. For now, the rate keeps the immediate bearish scenario at bay, but the broader market structure points toward a clear downturn ahead.

Final Summary

  • Spot buyers spent $363,830 on $XDC in the past four days, with perpetual market OI rising 9.97% to $4.8 million.
  • $XDC is approaching the upper Bollinger Band and a supply zone simultaneously as the A/D indicator drops to 2.05 billion in volume.

0
0

Disclaimer: The content of this article solely reflects the author's opinion and does not represent the platform in any capacity. This article is not intended to serve as a reference for making investment decisions.

Understand the market, then trade.
Bitget offers one-stop trading for cryptocurrencies, stocks, and gold.
Trade now!

You may also like

AI bubble alarm rings across Wall Street! Oaktree Capital's Marks disagrees: The market hasn't reached its most dangerous moment yet, and investors are not completely oblivious to risks.

Although investors are displaying typical FOMO (fear of missing out) sentiment regarding further gains in tech stocks, the market continues to draw comparisons between the current situation and past bubbles, indicating that investors are not unaware of the risks.

智通财经•2026/10/19 01:26
AI bubble alarm rings across Wall Street! Oaktree Capital's Marks disagrees: The market hasn't reached its most dangerous moment yet, and investors are not completely oblivious to risks.

Barclays: Dual restrictions of physical and capital, data center growth will slow significantly in 2027!

Barclays' latest report reveals that the global data center construction boom is approaching a turning point—the year-on-year growth rate of new capacity will plummet from over 100% in 2026 to about 35% in 2027, and stabilize by 2028. Facing both physical constraints and tightened financing, hyperscale cloud providers will absorb more than 60% of new capacity, while the risk of project suspension for small and medium developers will sharply increase.

华尔街见闻•2026/10/19 01:26
Barclays: Dual restrictions of physical and capital, data center growth will slow significantly in 2027!

AI Capital Flow Chart: Nvidia Takes 690 Billion, Remaining 499 Companies Share 340 Billion

Morgan Stanley has released its first comprehensive overview of AI capital expenditure: In 2027, among $1.58 trillion in spending by hyperscale cloud service providers, Nvidia alone will take 67%, while the remaining 499 S&P component companies will collectively receive only $339 billion. A more hidden risk lies in over $1.1 trillion of "off-balance-sheet leases," which are essentially disguised debt. 2027 is predicted to have the largest free cash flow shortfall, and the risks of both volume and price declines are being severely underestimated by the market.

华尔街见闻•2026/10/19 01:11
AI Capital Flow Chart: Nvidia Takes 690 Billion, Remaining 499 Companies Share 340 Billion