
Fed Chair Succession = US Stock Market Plunge?

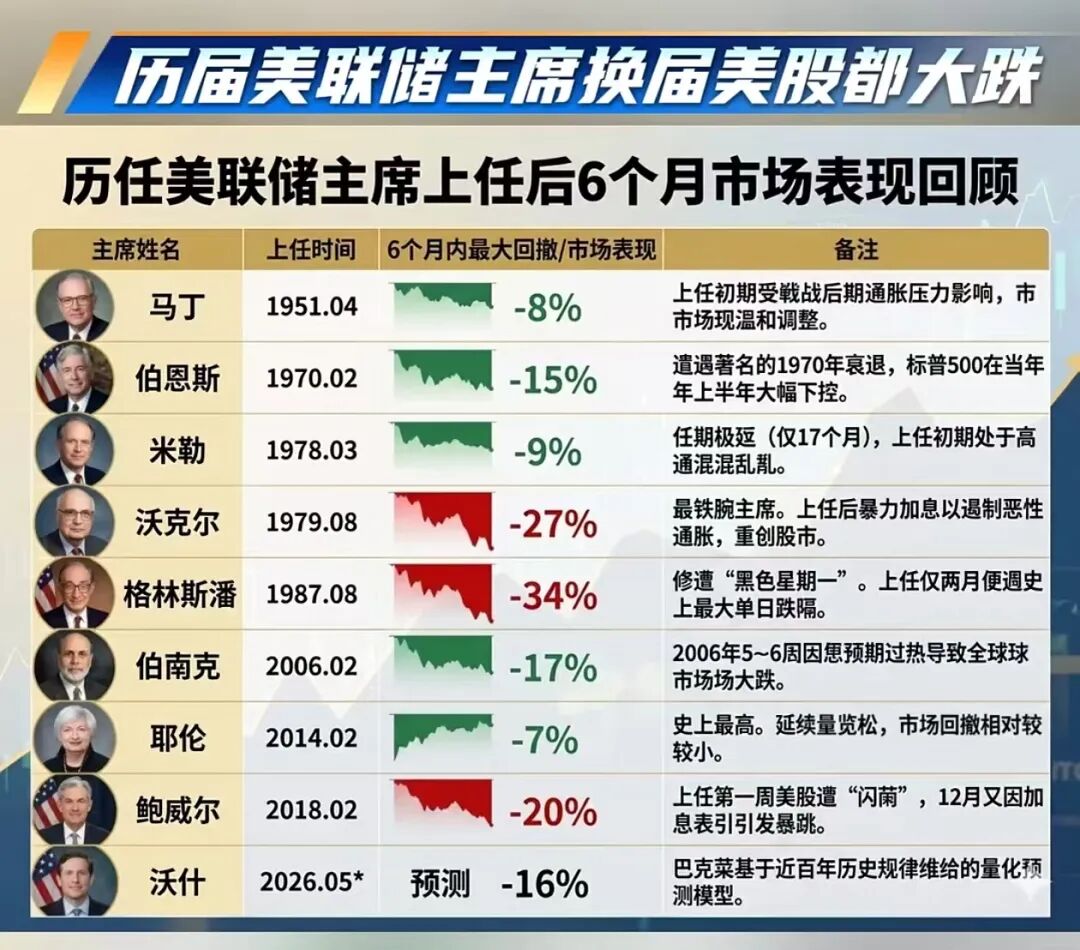
2. Take Powell as an example. He was sworn in on February 5, 2018, whereas the early 2018 flash crash occurred on January 26. Using calculation A, the maximum drawdown within six months of Powell’s appointment was 2.56%. Using calculation B, the max drawdown was 9.45%—both significantly lower than what’s shown in the chart.
3. Furthermore, regardless of which drawdown calculation is used, the maximum drawdown within six months of a Fed chair taking office is not significantly different from the maximum drawdown over any random six-month period in S&P500 history.
4. Using calculation A:
1) The maximum six-month drawdowns after the last seven Fed chair appointments are as follows:
Miller (1978-03-08): 0.00%
Volcker (1979-08-06): 4.25%
Greenspan (1987-08-11): 32.82%
Bernanke (2006-02-01): 4.58%
Yellen (2014-02-03): 0.00%
Powell (2018-02-05): 2.56%
2) Distribution of maximum S&P500 drawdowns over any six-month period in history:
10th percentile: 0.09%
25th percentile: 1.44%
75th percentile: 8.98%
90th percentile: 16.24%
The medians are nearly identical. Statistical tests for equality of means: t-test p=0.2870, Wilcoxon test p=0.3438; there is no significant difference.
5. Using calculation B
1) The maximum drawdowns for the last seven chairs within six months of taking office:
Burns (1970-02-01): 23.21%
Miller (1978-03-08): 17.12%
Volcker (1979-08-06): 13.31%
Greenspan (1987-08-11): 33.51%
Bernanke (2006-02-01): 7.70%
Yellen (2014-02-03): 12.38%
Powell (2018-02-05): 9.45%
2) Distribution of maximum S&P500 drawdowns over any six-month period in history:
10th percentile: 7.80%
25th percentile: 9.97%
75th percentile: 17.74%
90th percentile: 22.12%
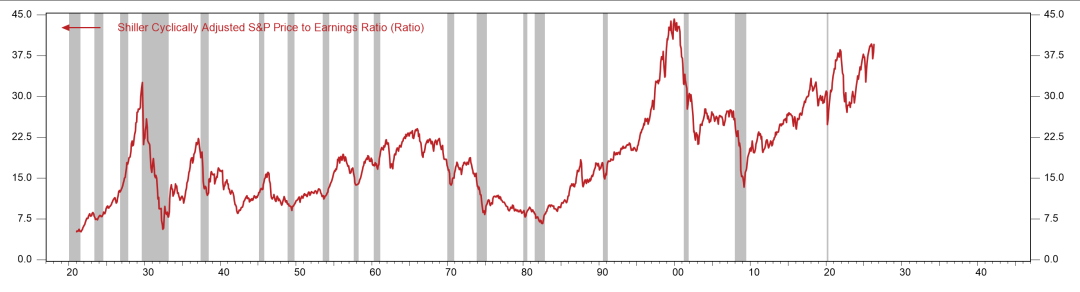
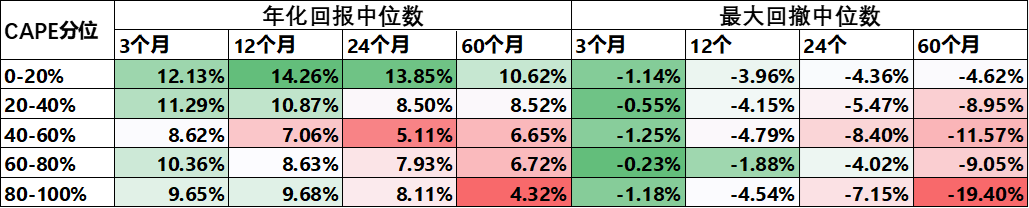
6. In summary, by historical pattern, significant drawdowns in U.S. stocks occur almost every six months, this is the historical norm, and the next six months will likely be no exception. Moreover, given that U.S. equity valuations are at historically high levels, future drawdown magnitudes may even exceed the historical medians.
Disclaimer: The content of this article solely reflects the author's opinion and does not represent the platform in any capacity. This article is not intended to serve as a reference for making investment decisions.
You may also like

XRP Ledger Tokenization Hits $6.3B Record

Crypto Rover targets $100 XRP, $1 million Bitcoin, $50,000 Ethereum in bold forecast
Iran conflict impact, major exporter turns to imports: Qatar signs long-term deal with US to purchase 4 million tons of LNG annually until 2054
Qatar has reached its first LNG purchase agreement with the US, and the largest US LNG exporter, Cheniere Energy, will begin deliveries in 2031. Due to damage to domestic industrial cities during the conflict and turbulence in the Strait of Hormuz, Qatar has to use US production capacity to fill its own gap in order to maintain its contractual commitments to customers.

Crypto prices
More


