
"Sell everything in Europe"! The third-largest sell-off in a decade, all funds capitulate

Multiple data sources indicate that European assets are experiencing one of the most intense sell-off waves in nearly a decade, with institutional investors reducing their European exposure at an extremely rapid pace.
According to Goldman Sachs Prime Brokerage data, last month's net selling of European assets saw the largest monthly decline since March 2025, ranking third highest over the past ten years, with a short-to-long ratio as high as 2.2 to 1.
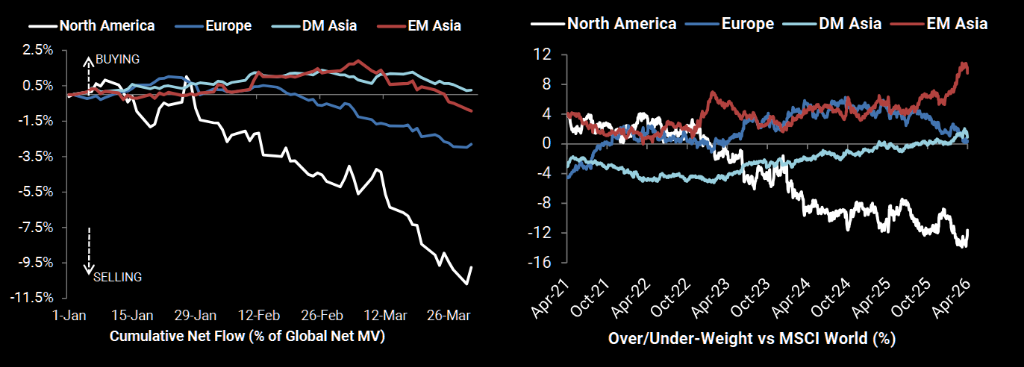
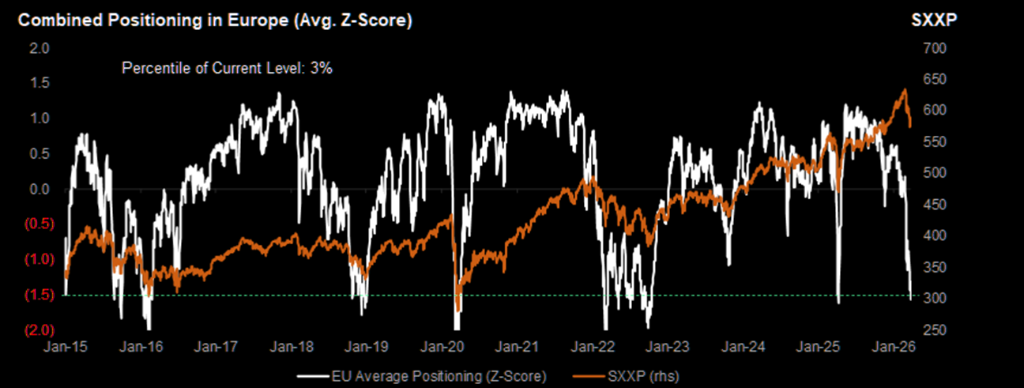
Meanwhile, JPMorgan data shows that the composite European positioning indicator has fallen to its third lowest level since 2015, with the standard deviation below negative 1.5, and the 4-week position change dropping even further beneath negative 2 standard deviations.
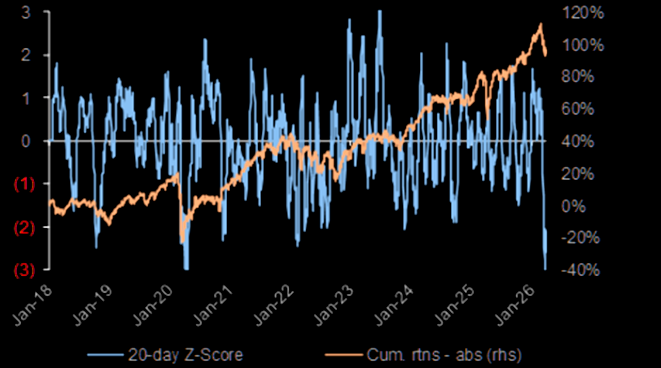
This figure means that the current net short pressure on European positions is already at an extreme in the past decade's historical distribution, with similar readings only occurring after a few significant episodes of market stress.
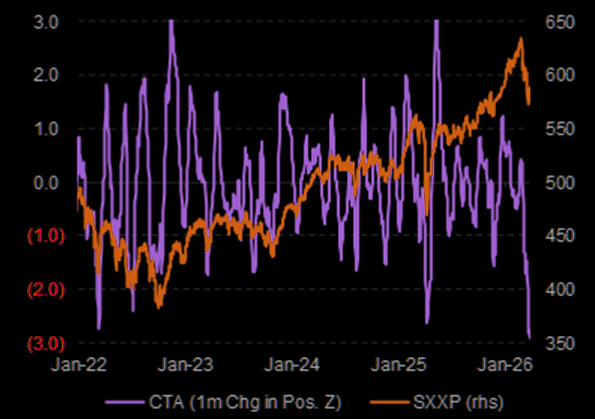
JPMorgan data further shows that, based on the 1-month positioning change Z-score, the scale of position reduction in European assets by CTA groups has reached the most extreme level in the history of this data series.
As representatives of trend-following strategies, sudden CTA exits often have a self-reinforcing effect, creating additional downside technical pressure in the market.
The JPMorgan positioning team points out that when considering hedge funds, CTAs (Commodity Trading Advisors), and pure long-only funds together, overall European positions are at a "very low level."
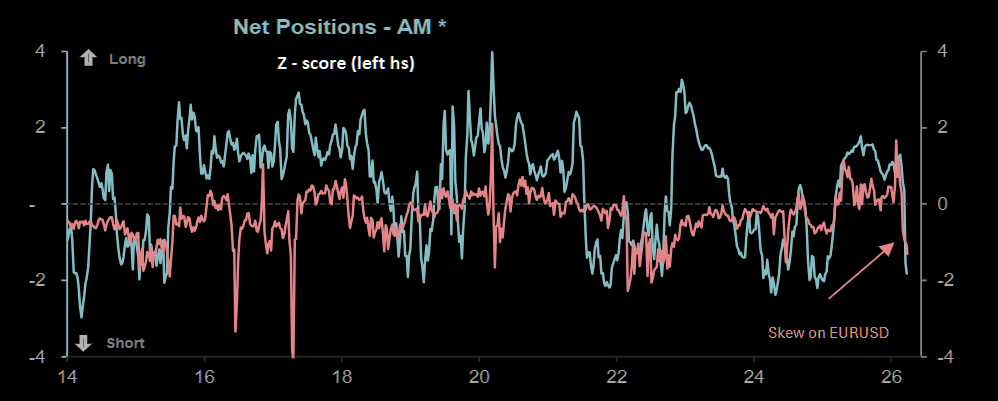
The signs of capital outflow are not only evident in equity holdings, but the foreign exchange market also confirms a systematic risk-averse trend.
The skew in the euro options market continues to decline, indicating that options market participants have largely turned to betting on further euro downside.
Disclaimer: The content of this article solely reflects the author's opinion and does not represent the platform in any capacity. This article is not intended to serve as a reference for making investment decisions.
You may also like
How big is CoreWeave's funding gap? Goldman Sachs: Only $23 billion, buy! Bernstein: $76 billion, risky!
Bernstein points out that the Goldman Sachs model contains optimistic assumptions, while Goldman Sachs' own cash flow statement shows that it will incur $46.6 billion in new debt over the next two years—twice the headline figure of $23 billion. More importantly, Goldman Sachs holds over 1% equity in CoreWeave and serves as its underwriter. Currently, CoreWeave's unsecured bond yields have reached 15%, with the first DDTL repayment due right now, and losses are expected to continue until 2029.

JPMorgan says crypto regulatory moves partly offset Clarity Act failure, but risks remain

AI bubble concerns hit Asia-Pacific stock markets, South Korean stocks plunge 4% at one point, SK Hynix turns positive, gold drops below 4000 intraday
Samsung Electronics and SK Hynix both once fell over 4%. Later, SK Hynix turned positive, while Samsung Electronics remained down more than 2%. The Nikkei 225 Index dropped nearly 2%. The yield on Japan’s 10-year government bonds fell by 10 basis points to 2.78%. Safe-haven currencies such as the yen and Swiss franc strengthened, with the yen up 0.2% and the Swiss franc gaining 0.1%. Gold fell as much as 0.7% intraday, while spot silver dropped as much as 2% during trading. Brent crude climbed to a five-month high of $114 per barrel.
Crypto prices
More


