
Pi Coin Nears a New All-Time Low, But the Real Bottom Could Go Deeper

Pi Coin has already lost over 50% year-on-year, and new chart patterns suggest the worst may not be over. ATR shows fading momentum while money flow dries up, raising fears of a deeper drop below current support.
Pi Coin has been one of the worst-hit tokens over the past year, sliding more than 50%. Many traders were hoping that PI would catch a bigger bullish wave with the rest of the altcoin market.
But the latest charts show a different picture; not only is PI price close to setting a new all-time low, but the real bottom could be even deeper than most expect.
ATR Shows Falling Volatility, But Not the Kind Bulls Want
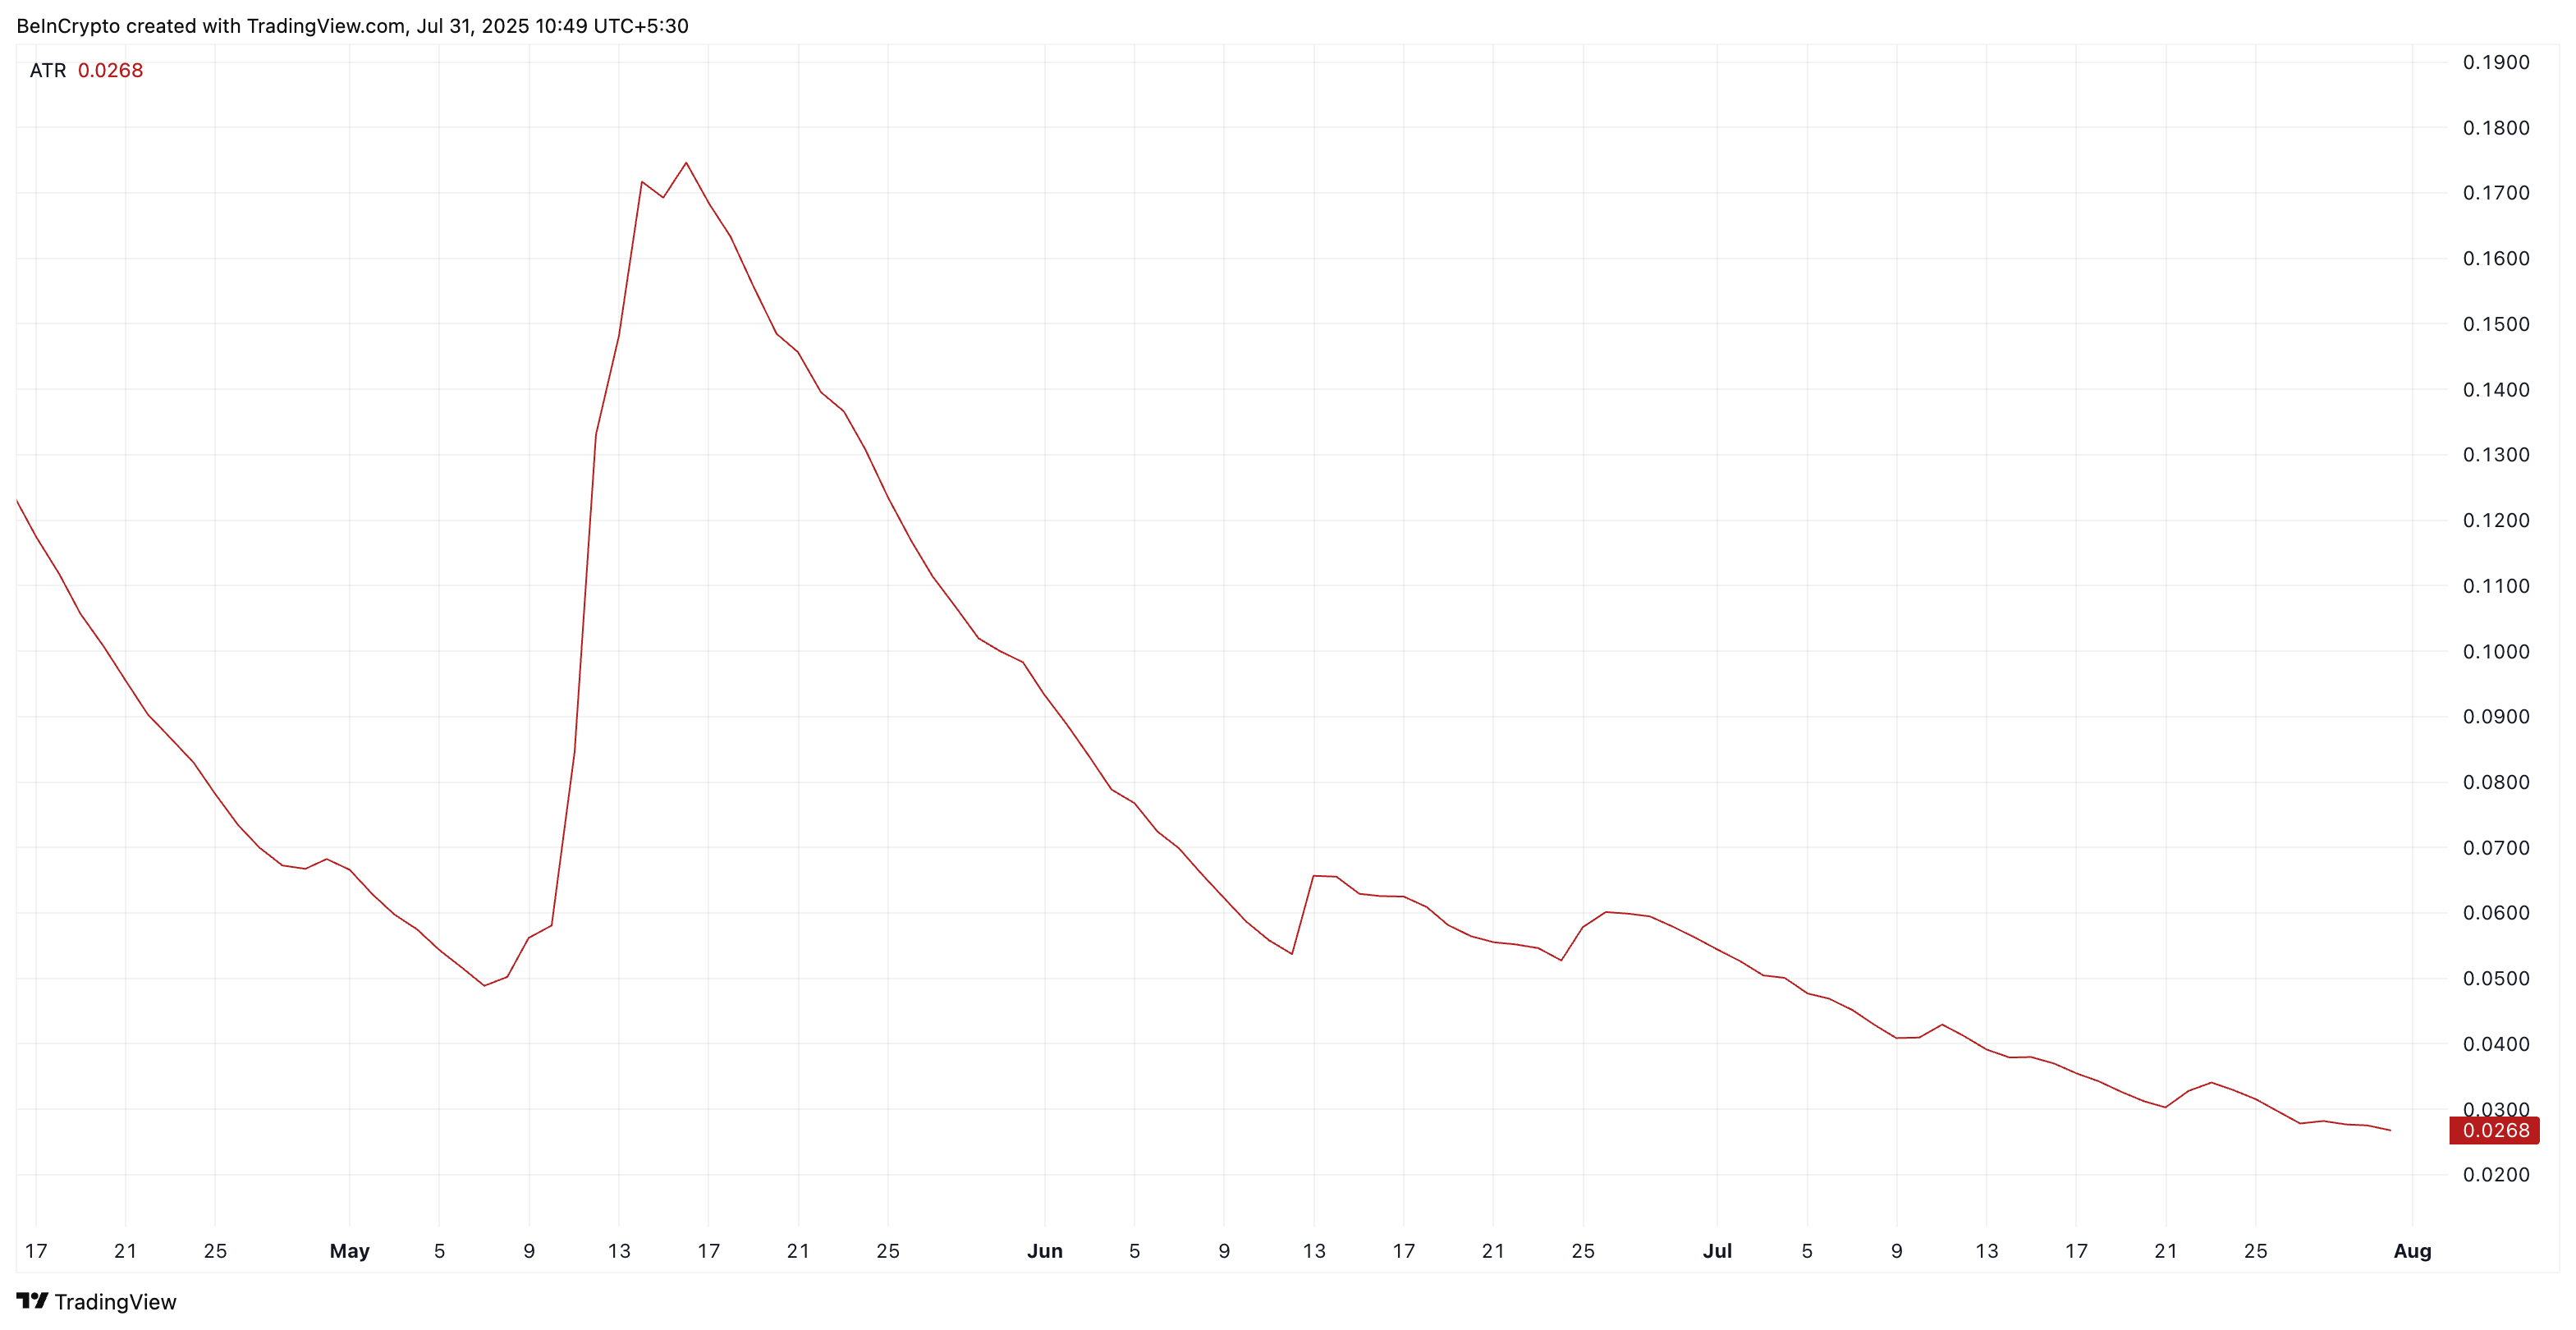
The first warning sign comes from the Average True Range (ATR), a tool that measures how big price moves are. When Pi Coin hit highs near $1.66 in May, ATR was at 0.17, signaling strong momentum and active trading.
For token TA and market updates: Want more token insights like this? Sign up for Editor Harsh Notariya’s Daily Crypto Newsletter .
 Pi Coin and ATR:
TradingView
Pi Coin and ATR:
TradingView
Today, ATR has collapsed to just 0.0268. This sharp decline means price moves have become small and weak. Instead of a fight between buyers and sellers, the market feels like a slow bleed, with sellers still in control.
Low ATR during a downtrend usually means there’s no energy for a bounce; just quiet selling pressure grinding the price lower.
Money Flow Index Shows Buyers Losing Interest
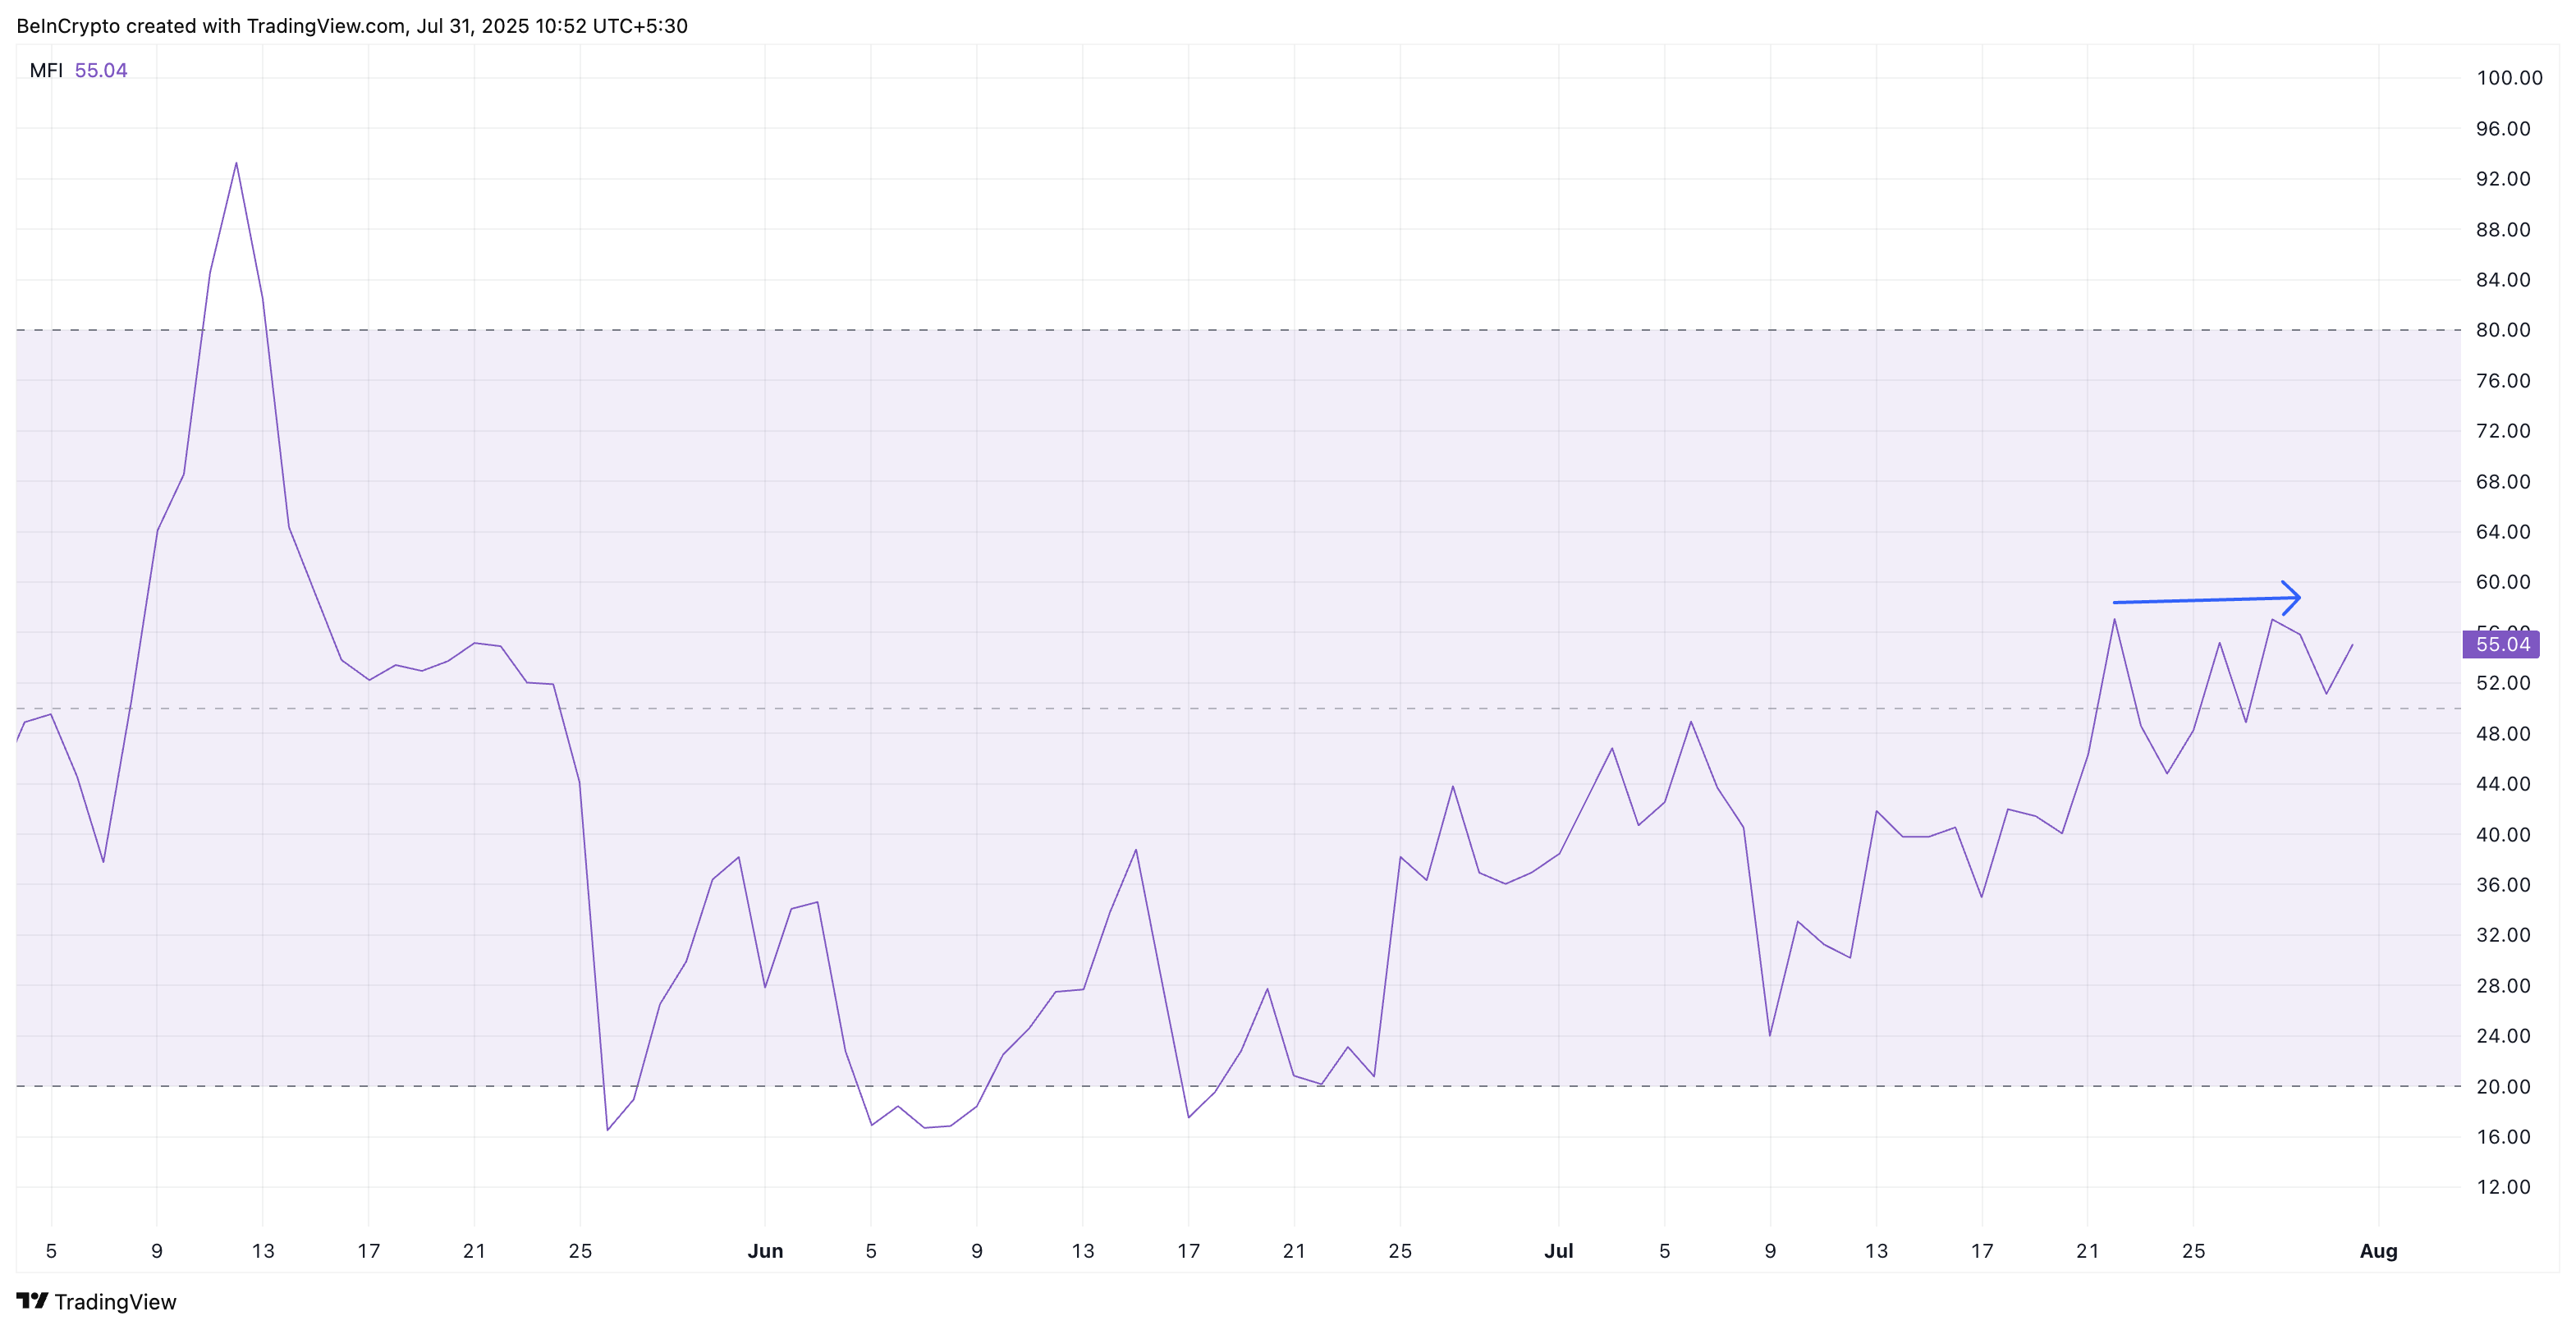
The Money Flow Index (MFI) tells a similar story. This indicator combines price and volume to show whether money is flowing in or out of a token.
 Money Flow Index for Pi Coin:
TradingView
Money Flow Index for Pi Coin:
TradingView
Over the past 10 days, MFI has been stuck near 55. That’s not high enough to show real demand and not low enough to suggest panic selling either.
Earlier in July, when Pi Coin hovered around $0.47, there were signs of new money stepping in to defend the Support. That was the reason why PI always managed to bounce back after flirting with a swing low.
But that money flow has stalled now. Fewer buyers are taking interest, even at lower prices, making it harder for Pi Coin to bounce back in the short term.
Bearish Pattern Points to a Deeper Pi Coin Price Bottom
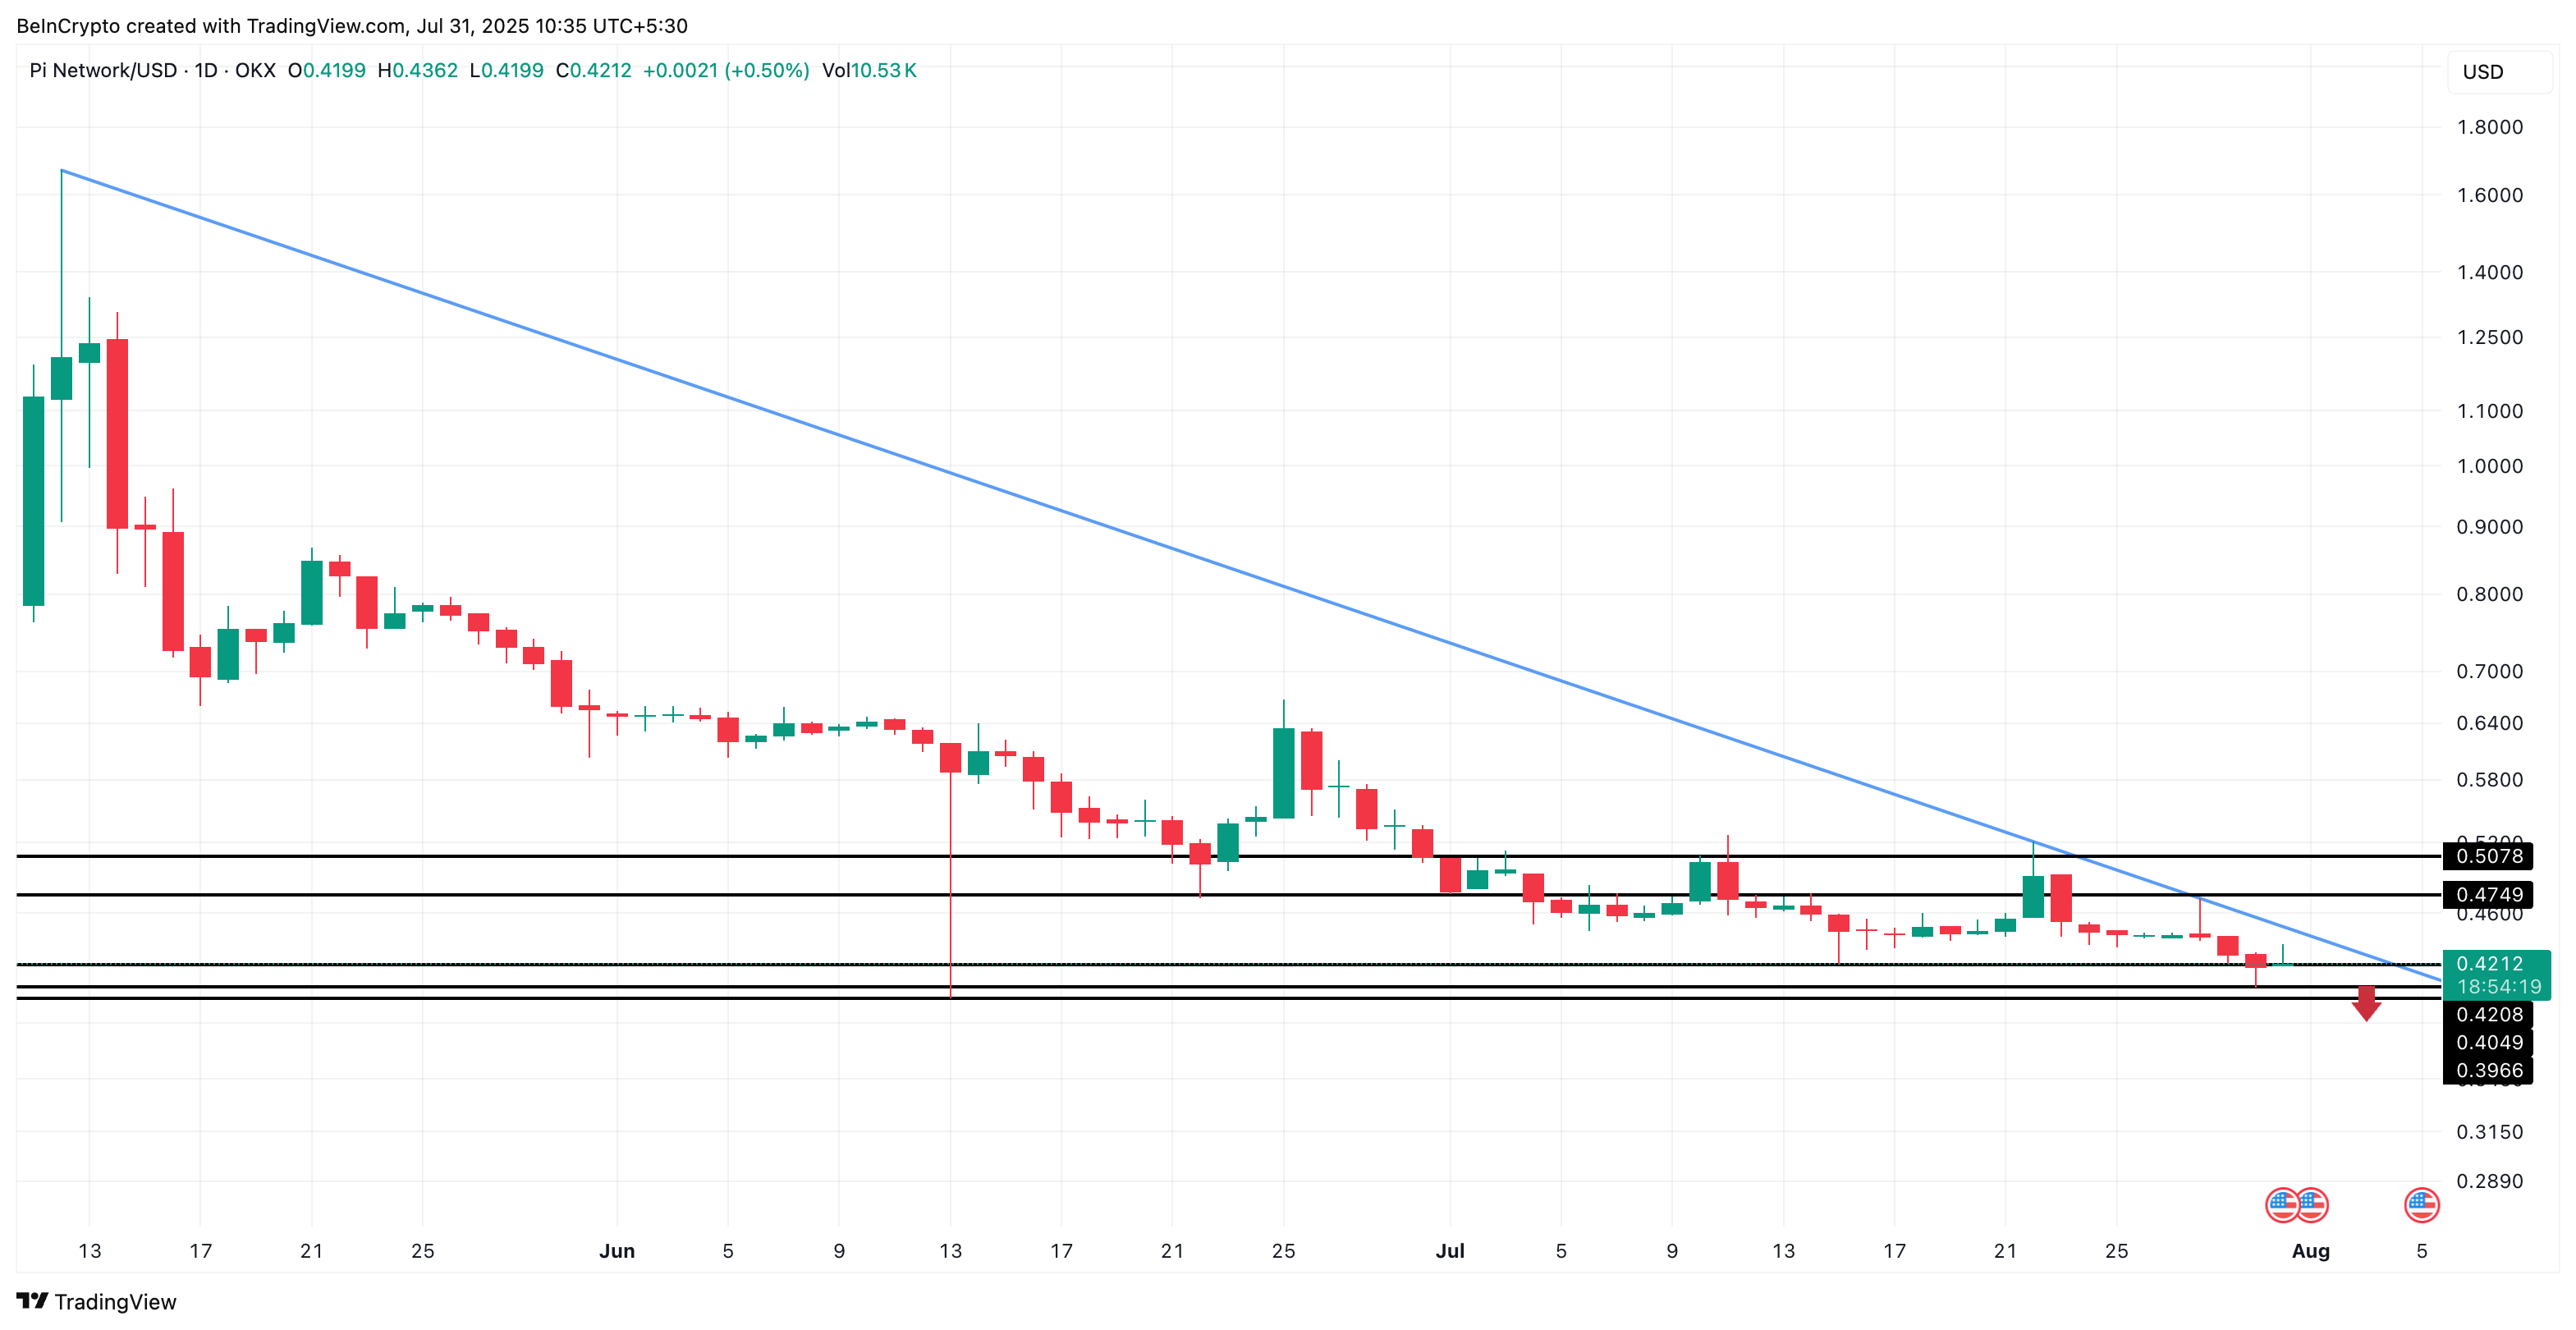
On the chart, Pi Coin is trapped in a descending triangle, a bearish pattern where lower highs continue to press against a fragile support level. For now, the immediate support lies at $0.42 and $0.40, breaking which looks all the more likely with not much capital being deployed.
 Pi Coin price and bearish pattern:
TradingView
Pi Coin price and bearish pattern:
TradingView
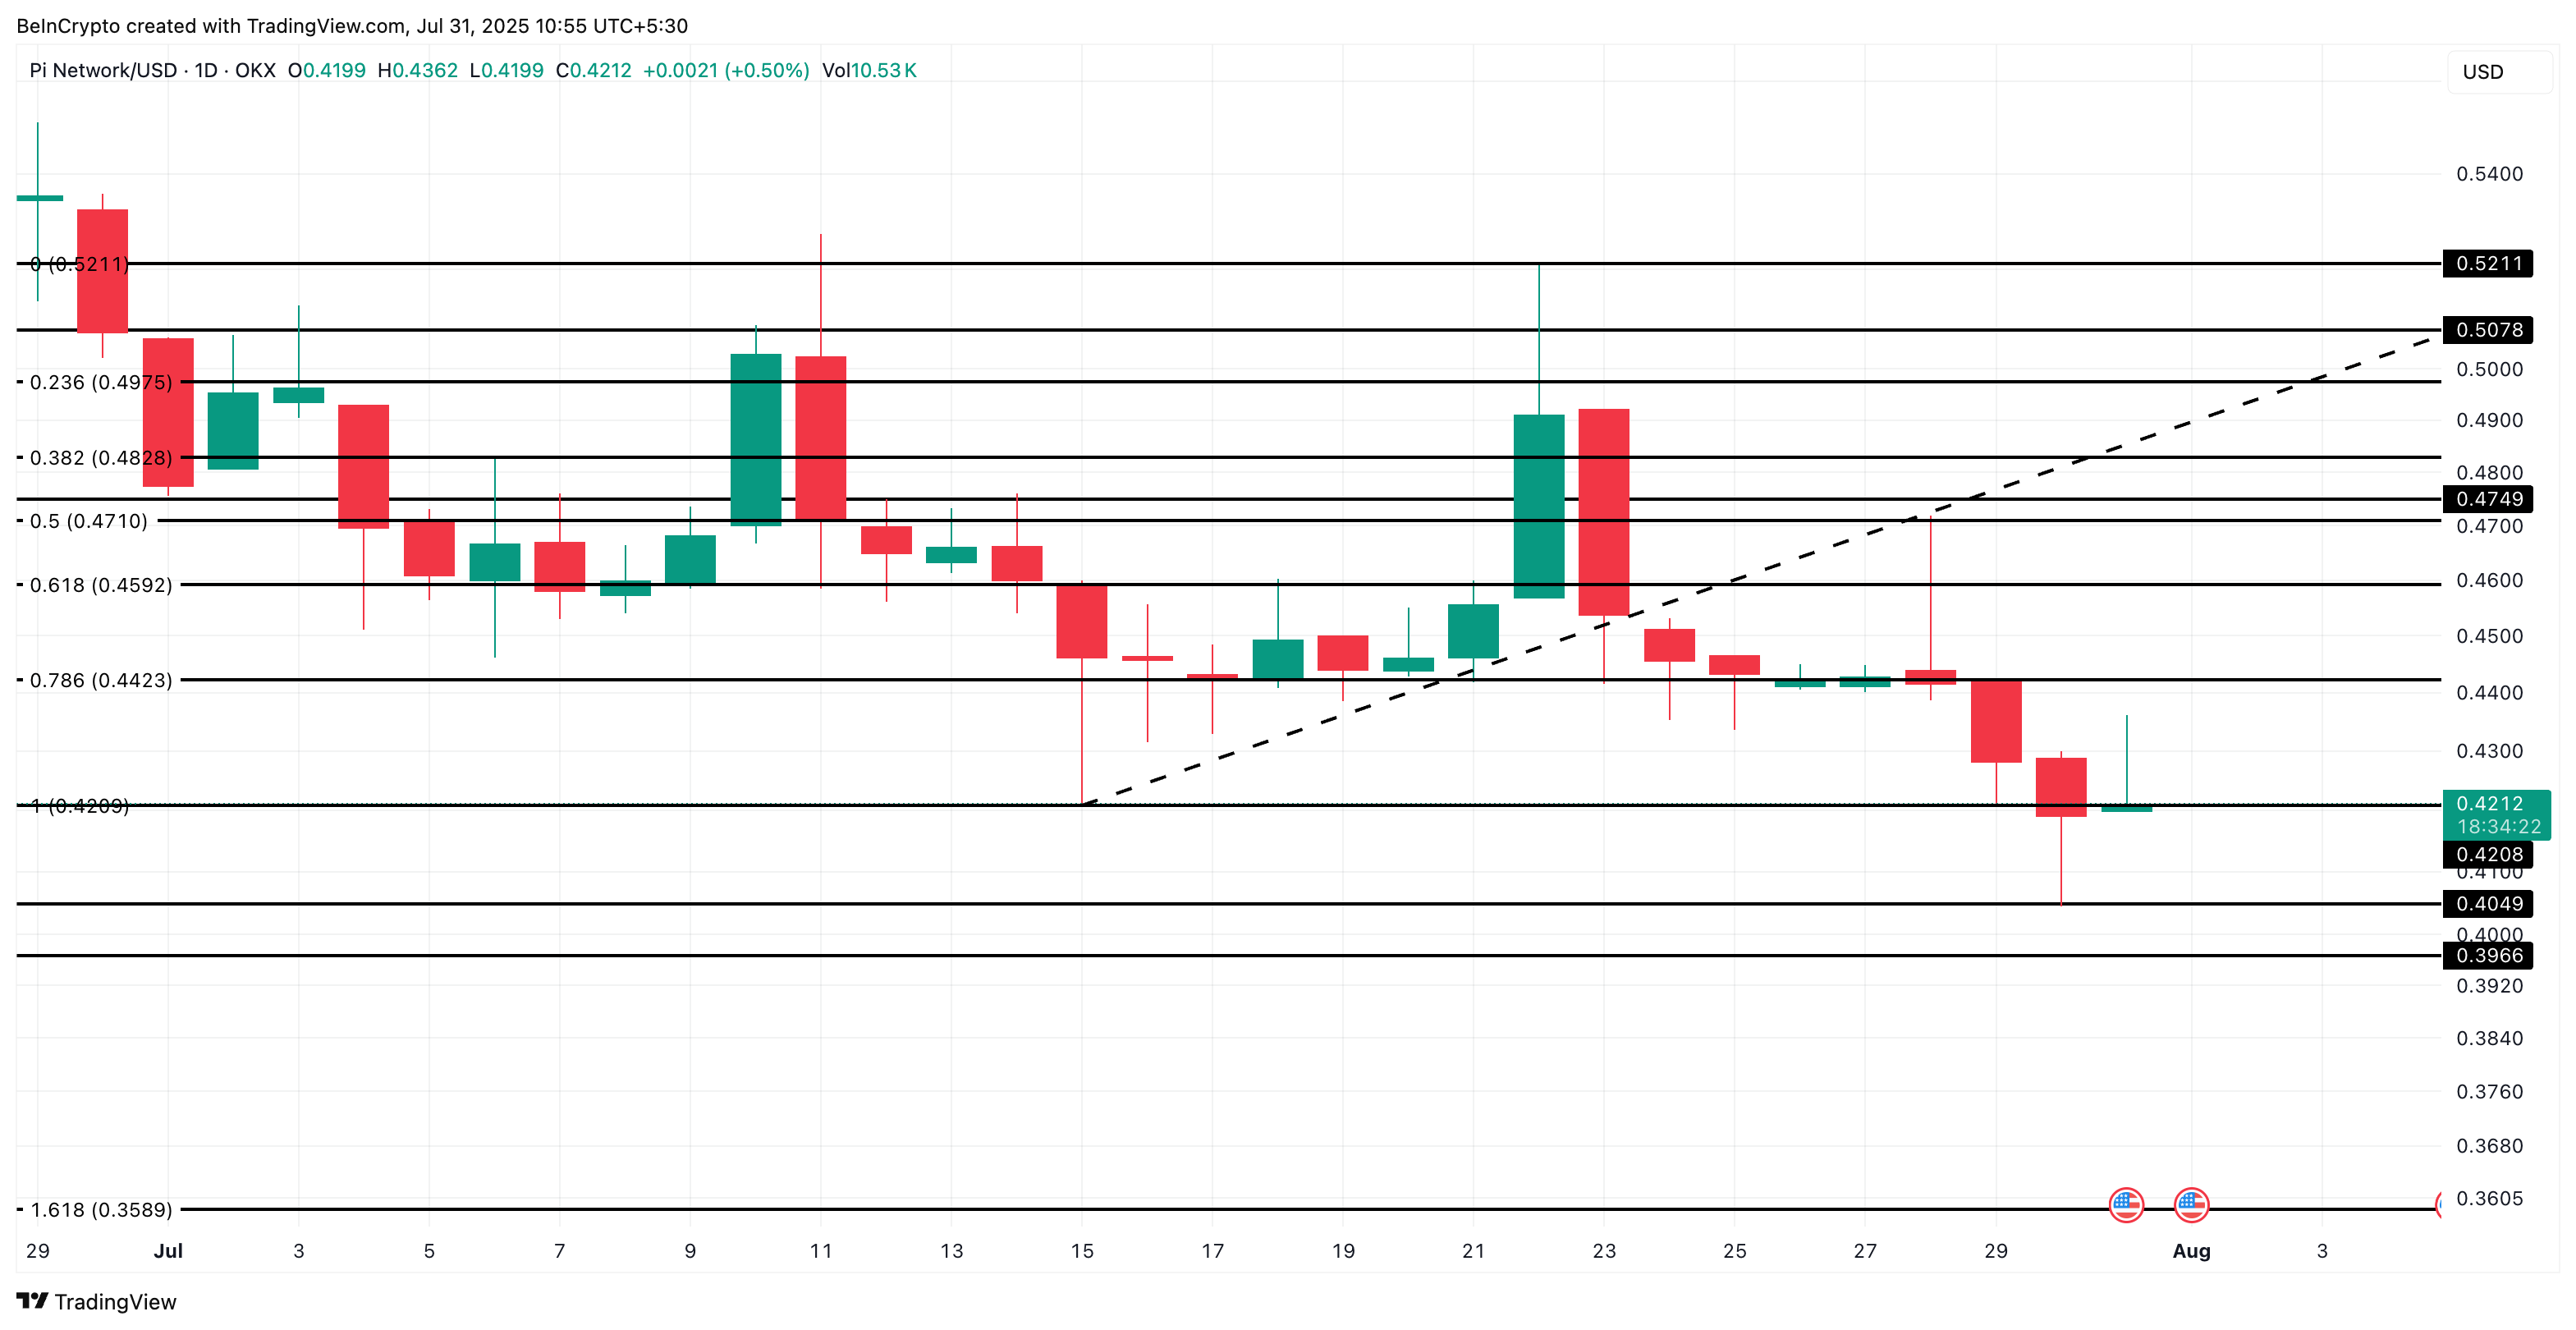
If the $0.40 floor gives way, key support and Fibonnaci retracement levels point to $0.39 and even $0.35 as the next potential bottoms, both below the current all-time low.
 Pi Coin price analysis:
TradingView
Pi Coin price analysis:
TradingView
For a recovery, Pi Coin would need to break above $0.44 and $0.45 to invalidate this near-term bearish setup. However, that kind of invalidation would require the ATR and MFI levels to rise.
Disclaimer: The content of this article solely reflects the author's opinion and does not represent the platform in any capacity. This article is not intended to serve as a reference for making investment decisions.
You may also like
Jensen Huang: Nvidia chip sales will double next year compared to this year, AI cannot be regulated like social media
Jensen Huang opposes applying social media regulations directly to AI, arguing that social media is a product, while AI is an underlying technology that supports other technologies and products. He believes regulation should target products, not the technology itself. He emphasizes rigorous testing and states that products should be withheld from release if they are not safe enough. "AI safety is of utmost importance."
What to buy after the Federal Reserve raises interest rates? Historically, US energy and technology stocks outperform while real estate lags. Goldman Sachs: The pace of rate hikes determines the US stock market.
U.S. stock performance in the 12 months after the first Federal Reserve rate hike: According to Jefferies, the energy sector led with an average return of 22.4%, followed by information technology at 15.4%. According to Charles Schwab, real estate underperformed the S&P 500 by 4.3%, making it the worst of the 11 sectors. Goldman Sachs states that the pace of rate hikes is the core variable affecting U.S. stocks; currently, if the 10-year U.S. Treasury yield rises by 50 basis points within a month, it will create "rapid rate hike" pressure.
Bank of America Ripple Report Fuels XRP Debate
Gold surges over 2%, US dollar retraces gains after Federal Reserve decision
Crypto prices
More


