Copper Prices ‘Out of Control’? Insights from the Supply Cycle
Key Insights
The primary determinant for the central price level of copper is supply. In every supply cycle, the second half corresponds with a shift upward in the central price level of copper. It is the supply cycle that contains the real opportunity for copper prices.
History also teaches us that, beyond supply, there are three other factors to watch when identifying copper price inflection points: ① Declining buffers in inventory and idle capacity; ② The emergence of new demand that is insensitive to high prices; ③ The next round of copper mining requires higher capital expenditure and incentive prices.
Looking through this lens at this round of strong copper prices (from 2021 onwards), all these conditions are met. Therefore, copper prices have already achieved a significant step up in their central price level.
Weak traditional demand was once mistakenly thought to be a potential risk for copper prices to fall back, but in reality, with subdued traditional demand and insufficient new demand replacement, and the inability for a new round of copper mine supply to significantly expand, copper prices are currently in a phase of low supply elasticity, which is fundamentally why prices have decoupled from prior anchors in this cycle.
Although copper prices may fluctuate in the future, the new central price level is already established.
Summary
Traditional copper price analysis often starts from global manufacturing, real estate, or inventory cycles—this framework can explain short-term copper price fluctuations (3-5 years), but finds it hard to answer a more important question: Why does the same demand growth rate correspond to very different copper price levels at different periods?
We attempt to analyze the longer-spanning mining capital expenditure-capacity cycle, examining how changes in the supply curve affect the central price level of copper, and thereby explain why in this round copper prices have outperformed the traditional demand cycle and shown extremely robust performance.
I. From WWII to Today: Four Major Copper Supply Cycles, with Prices Oscillating Around Moving Central Levels
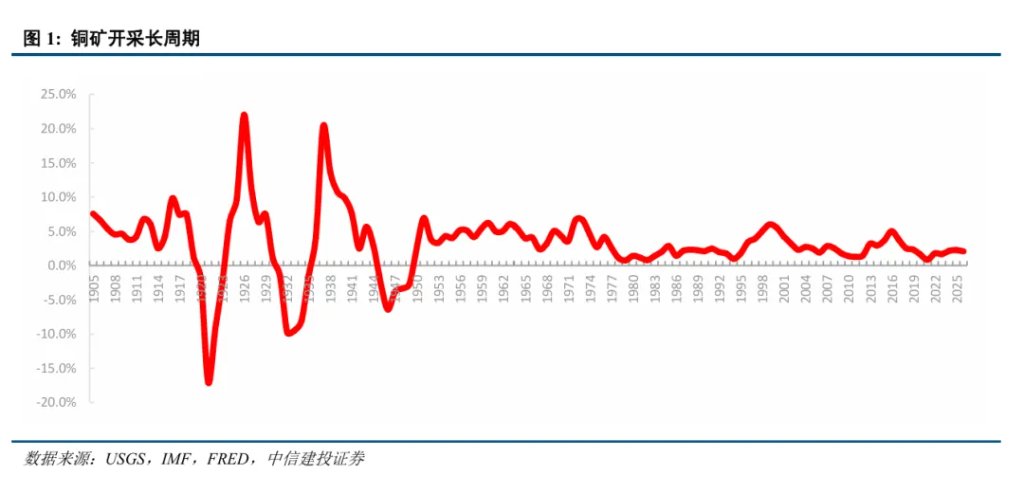
Looking at global copper mine growth since 1900, it is clear that the growth rate of production from 1900 to 1950 was far more volatile than after 1950. Post-WWII, copper mine development gradually shifted from high-grade ores to large-scale, low-grade porphyry copper deposits, with capital deepening altering the supply response mechanism.
Thus, we choose 1950 as the starting point for studying modern copper mine supply cycles—not simply to avoid earlier, more volatile fluctuations, but because the meaning of mine supply growth changes substantively around 1950: previously, it reflected short-term adjustments amid war, depression, and intermittent production; afterwards, large-scale capital investment and global resource center expansion meant copper supply growth became increasingly a function of lagged responses to the previous price and investment cycle.
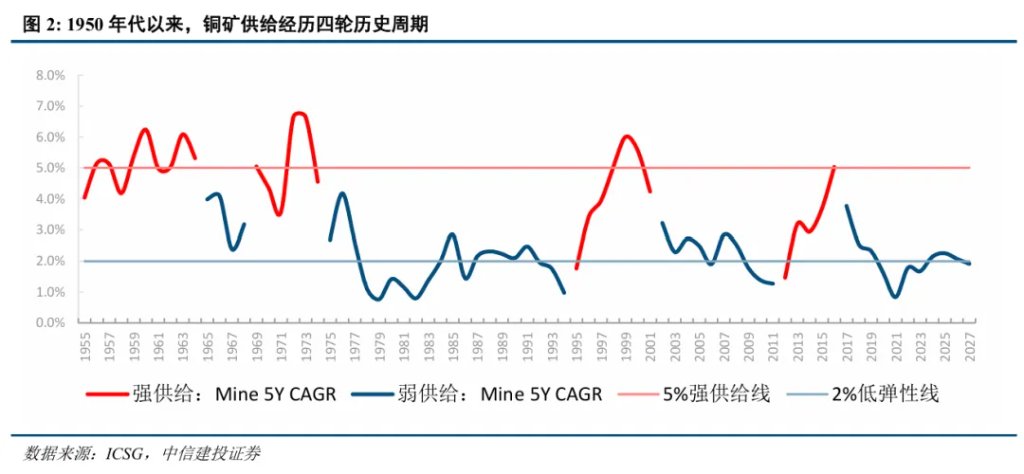
Using the compound growth rate of global copper mine production as a gauge of supply strength, we observe four major supply release cycles since the 1950s.
Historically, when the five-year CAGR lifts persistently above 4%-5% and repeatedly reaches or exceeds 5%, it typically marks a period when previously invested large projects are coming online en masse—a “strong supply release phase”. When the five-year CAGR falls back to around 2%, it means earlier project reserves are depleted and supply returns to a low-elasticity state.
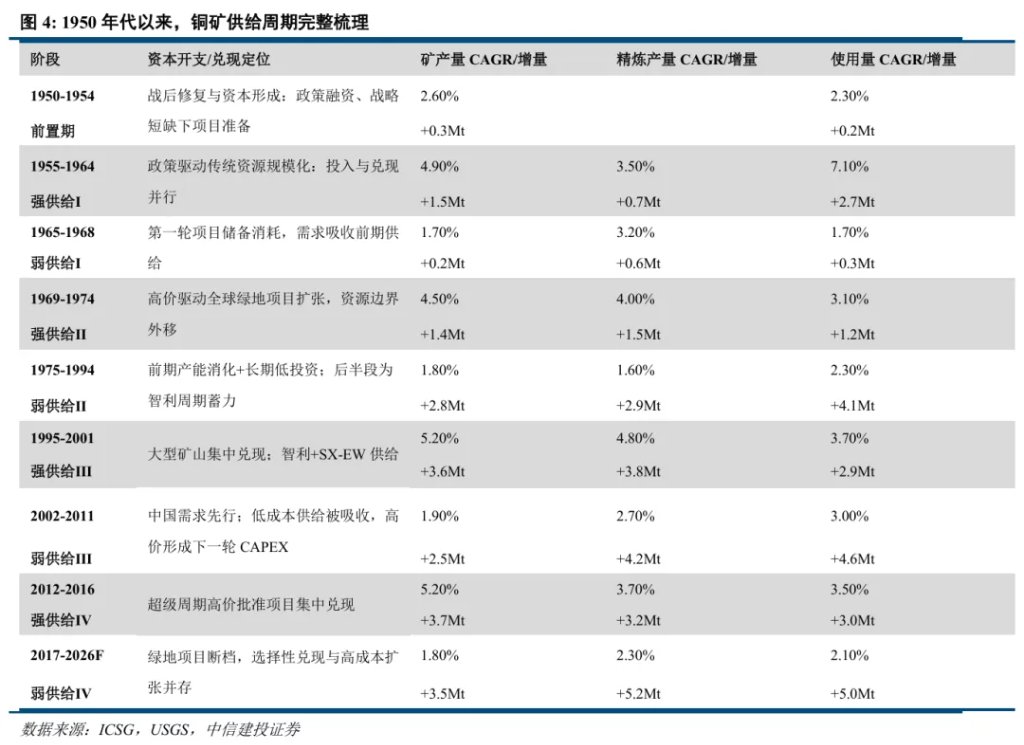
The first supply cycle lasted from 1955-1968 (14 years), split into two phases: 1955-1964 (10 years) of strong supply release (mine production CAGR 4.9%), and 1965-1968 (4 years) of weak supply (CAGR fell to 1.7%).
The second supply cycle spanned 1969-1994 (25 years): 1969-1974 (5 years) of strong supply release (CAGR 4.5%), followed by 1975-1994 (20 years) of weak supply (CAGR 1.8%).
The third supply cycle was 1995-2011 (17 years): 1995-2001 (7 years) strong supply release (CAGR 5.2%), and 2002-2011 (10 years) weak supply (CAGR 1.9%).
The fourth supply cycle, 2012 to present (15+ years): 2012-2016 (5 years) strong supply release (CAGR 5.2%); 2017-2026F (9 years) switches to weak supply (CAGR 1.8%).
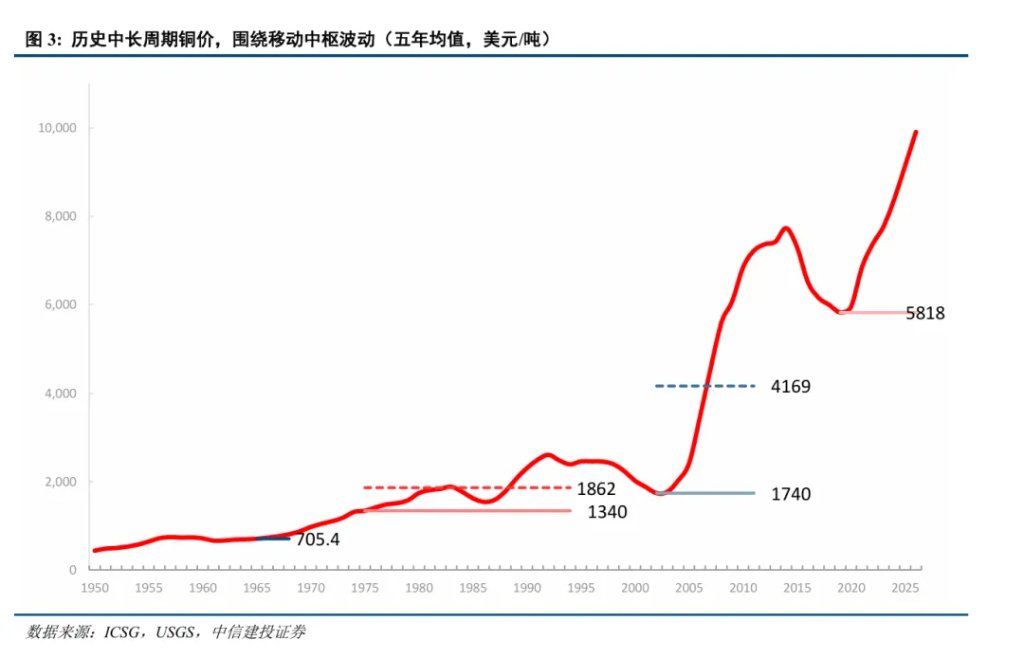
Correspondingly, copper prices have not fluctuated around a fixed mean over the long term, but instead have continually broken away from old levels and established new price ranges with each supply cycle transition.
By thoroughly reviewing the data, we analyze why after each strong supply release ends, the next cycle often sees copper prices entering a higher plateau rather than reverting to the original mean.
II. First Supply Cycle: Policy-Driven Large-Scale Resource Development (1955-1964)
The first wave of strong supply release was not solely market-price driven; the US government actively reduced investment and sales risks in copper resource development through strategic reserves, financing, and purchase guarantees.
The Korean War and early Cold War industrial mobilization further heightened US strategic resource security needs. The 1946 Strategic and Critical Materials Stock Piling Act established reserve targets and procurement frameworks; the 1950 Defense Production Act further supported new and idle mines to expand or maintain capacity via government loans, long-term purchase contracts, and tax depreciation benefits. Together, these policies turned national security needs into investment conditions for mines.
New supply in 1955-1964 primarily involved expansion, recommissioning, and known ore development in traditional mining areas. Geographically, the southern African Copperbelt, North American mines, and the Chile–Peru Andes belt formed the three main centers of new supply, with the Soviet Union and Eastern Europe also major sources of incremental production.
Global copper mine output increased from 2.9 million tons in 1955 to 4.443 million tons in 1964, a cumulative increase of approximately 1.54 million tons. North America, benefiting most directly from US policy support, saw capacity expansions in both marginal and lower-grade mines. Outside North America, most new supply came from Western mining capital-driven projects in Zambia–Congo and the Andes. The Soviet Union and Eastern Europe contributed roughly 384,000 tons during 1955-1964, representing independent expansion within the socialist industrial system.
Supply expansion initially suppressed prices, with the price drop in 1957-1958 aligning closely to the first capacity release. The supply dividend was absorbed by demand, and the price-setting focus gradually shifted from new capacity to marginal supply disturbances, leading to a shift upward in the central price level.
By 1964, as postwar industrialization continued, prior excess capacity was absorbed, giving copper prices the grounds for a cyclical upturn.
Global mine copper production rose from 4.443 million tons in 1964 to 5.01 million in 1968, a CAGR of about 3%, down from 5.3% for 1955-1964; the slowdown in supply growth and higher production costs restrained further copper price declines. As the supply cycle shifted from strong to weak, price determination increasingly relied on marginal supply shocks, with strikes and transport risks amplifying market gaps, and high copper prices reinforcing labor demands and resource nationalism.
From 1965 to 1974, the median nominal price was about $1,090/ton, significantly above the $683/ton average from 1955 to 1964.
III. Second Supply Cycle: High Prices Drive Global Resource Expansion (1969-1974)
The second wave of supply expansion was driven by both high prices and resource security: as idle supply created by the first wave was absorbed by industrial demand, inventory buffers fell, and the market paid bigger premiums for new resources and unplanned supply disruptions.
In the late 1960s, demands from the electrical grid, automobiles, construction, appliances, and industrial equipment persisted, quickly erasing previous surpluses. US strategic copper reserves dropped from about 1,036,000 tons at end-1963 to 250,000 tons in 1967, greatly reducing the available supply buffer for consumers.
Following the 1971 "Nixon Shock," the Bretton Woods system began to dissolve, collapsing completely in 1973 when major currencies switched to floating exchange rates. At this time, dollar depreciation, inflation, and the financialization of physical inventories also became essential aspects of asset pricing.
From 1969 to 1974, new copper supply further shifted to global greenfield, lower-grade, and large-scale resources. Regionally, resource frontiers extended from traditional US mining districts to Canada, the Andes, Southeast Asia, Africa, and Oceania, requiring integrated development in mining, processing, energy, and transport infrastructure.
Global mine copper output rose from 5.682 million tons in 1969 to 7.097 million in 1974, a five-year increase of around 1.415 million tons. Western Canada and new Pacific Rim mining districts led growth for market economies, while Chile (Andes) and Zaire (now DRC) expanded capacity in traditional mine districts. The Soviet Union and Poland together contributed about 310,000 tons of net new production; the Soviet Union rose by 171,000 tons, Poland by 139,000 tons.
Compared with 1955—1964, copper mine development during 1967—1974 developed beyond simply expanding or reopening known ore bodies in traditional districts and moved toward global greenfield, lower-grade, and large deposit developments, with the supply cycle outlasting the price cycle.
Inflation and currency factors pushed up nominal prices—1969—1974 was the only strong supply surge among four cycles in which copper prices surged significantly.
The 1973—1974 price spike was not a copper-only bull market; it was part of a synchronized global commodity rally: after Bretton Woods, the dollar weakened and physical assets saw higher inflation-hedging demand. The World Bank later noted that in early 1974, copper prices continued to rise despite higher output, reflecting market expectations and speculative forces at work.
Two demand recessions (1975, 1982) prolonged inventory drawdown, delaying price upturns until after 1987, when inventory, idle capacity, and new project buffers all diminished and the central price level shifted upward.
After the 1974 supply acceleration ended, copper prices didn’t immediately start a sustained uptrend, but a new nominal price floor was established. Global mine copper output grew from 7.097 million tons in 1974 to 8.319 million in 1986—CAGR only about 1.3%, far below the 5.9% of 1969—1974; lower supply growth and higher production costs limited further price drops. However, demand recessions in 1975 and 1982 delayed inventory digestion and kept prices depressed for an extended period.
By the end of 1986, inventories had fallen to less than half the 1983 peak. In 1987, global commercial stocks dropped further from 890,000 to 520,000 tons; copper consumption was 10.44 million tons, exceeding production of about 10.21 million, taking the market from surplus to a physical shortfall.
From 1987—1990, the average nominal copper price was ~$2,474/ton, 71% higher than the $1,448/ton seen from 1982—1986, and stabilized at $2,450—2,550 per ton in 1991—1992. Thus, the new nominal central price was finally confirmed.
IV. Third Supply Cycle: Chile's Leadership and SX-EW Pathway
The third wave represented a convergence of globalization, resource opening, and technology diffusion—project pipelines built from the late 1980s to mid-1990s went into mass production, expansion, and ramp-up from 1995 to 2001.
During the 1990s, the electronics, energy, construction, and manufacturing sectors shifted toward East Asia, with Asia gradually becoming a major global market for refined copper. By the late 1990s, Asia absorbed a third of global refined copper demand, driving structural changes in demand expectations.
Chile's mining liberalization and global capital flows laid the institutional groundwork for this round of expansion.
This round of new supply was dominated by large Chilean porphyry mines, supplemented by large projects in Australia, Indonesia, Argentina, and Peru; the SX-EW process economically incorporated oxide ores, low-grade ores, and waste rock into the resource base.
Global mine copper output increased from 10.07 million tons in 1995 to 13.636 million in 2001—a surge of about 3.566 million tons in 6 years (CAGR ~5.2%), making this the largest surge of all cycles under review.
The Andes in South America were core; Chile alone accounted for around 60% of global net growth. At the project level, SX-EW reduced dependence on traditional smelting—refining for some projects, enabling direct cathode copper production from oxide ores and waste leaching, shortening the production chain. Its significance was mainly in expanding resource boundaries, not guaranteeing lower capital or operating costs for all projects.
After 2001, shrinking supply pipelines and accelerated Chinese demand (2002—2011) shifted copper markets from "overcapacity and suppressed prices" to "low supply elasticity and price re-rating."
After the investment surge ended, global copper output did not stop growing but its pace slowed significantly.
Low copper prices from 1997—2001 squeezed exploration budgets and greenfield investment, delaying or cancelling costly projects. Because large mines require many years from exploration to construction, the project drought of the late 1990s showed up as supply shortages from about 2003 onward.
Global mine copper output rose from about 13.6 million tons in 2002 to 16.1 million in 2011, CAGR about 1.9%, markedly lower than the 5.2% from 1995-2001.
Meanwhile, global refined copper usage grew from about 15.3 million tons to 19.9 million, CAGR about 3.0%, with China driving the new demand growth in this cycle.
After joining the WTO, China rapidly expanded its export manufacturing, appliances, machinery, and electronics sectors; urbanization, housing, power grids, and infrastructure all significantly increased copper intensity per unit GDP.
Between 2002—2011, the median copper price was about $5,936/ton, up around 227% compared to 1995—2001's $1,814/ton—triple the previous stage.
V. Fourth Supply Cycle: Super-Cycle CAPEX (2012–2016)
The fourth massive supply release was triggered by skyrocketing copper prices and booming Chinese demand from 2002—2011, resulting in historic capital expenditure that materialized from 2012—2016.
China’s own copper mine resources and output couldn't keep up with demand; new consumption increasingly relied on imported mines, concentrates, refined copper, and scrap. By 2011, China consumed about 40% of global copper, and its refined copper imports accounted for roughly 40% of world trade. Meanwhile, China’s investment share of GDP rose from 35% in 1980 to 49% by 2010; infrastructure and manufacturing made up about 27% and 31% of fixed assets investment, while housing investment's share of GDP climbed from around 5.5% in 2004 to about 9% in 2011.
As a result, mining companies no longer viewed Chinese demand as a typical cyclical rebound, but incorporated it into long-term demand forecasts and raised copper price and market capacity assumptions over project lifespans. Underpinned by demand expectations, higher copper prices, and better financing conditions, global mining CAPEX surged to record highs.
This round, supply was more geographically dispersed and reached an all-time high in volume, but still heavily relied on large sulfide ores and copper concentrate systems, making capital and execution more complex.
Regionally, Peru became the largest source of project-based incremental supply, Mongolia formed a new major resource center, Mexico and the US contributed through brownfield expansions, Africa's Copperbelt provided additional supply, while new projects in Chile mainly offset mature mine declines.
After the 2017 supply peak, greenfield project droughts and structural demand took over, lifting the price floor again.
Since 2017, new projects haven’t disappeared but are more dispersed and slow to ramp up, without the concentrated supply surge seen in 2012—2016.
Brownfield expansions took precedence over greenfield; mining companies, during low price periods, focused more on repairing balance sheets and maintaining existing assets. Meanwhile, declining ore grades, rising equipment and energy costs, and longer permitting, environmental, and community negotiation cycles made it harder to convert high prices quickly to new effective supply.
From 2017—2020, global mine copper production CAGR dropped to around 1.1%, down about 4.1 percentage points from 2012—2016.
From 2017–2020, the nominal copper price central level was about $6,221/ton; prices found a base, but lows did not return to pre-2016 levels.
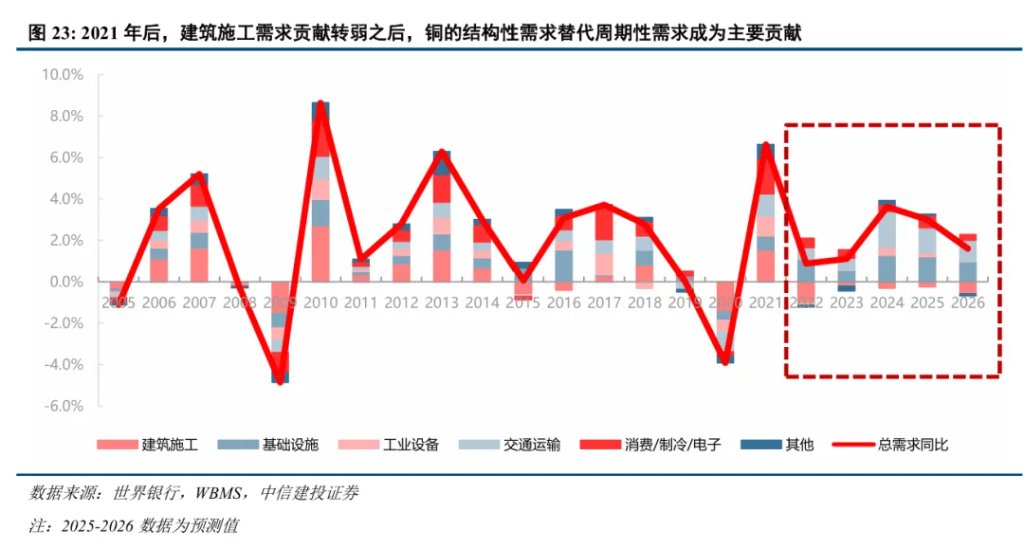
After 2020, structural demand has continued to draw on higher-cost resources. From 2021–2025, power grid investment, transport electrification, renewables, and digital infrastructure gradually become major new marginal demand sources. Compared with real estate or general manufacturing, these types of demand are more planned and less price-elastic in the short term.
Between 2021—2025, the average nominal copper price further rose to about $9,145/ton, up 47% from 2017—2020 and up 33% from 2012—2016. This suggests price levels have broken out of the previous platform and entered a new high range.
VI. Assessing Whether This Cycle Offers Support for a Higher Central Price Level
Across four cycles, the evidence shows that only after prior low-cost supply surges have been absorbed, and demand still calls for more resources, can copper prices break away from old platforms.
Thus, slowing supply growth is a critical signal for price re-rating, but is not a sufficient standalone factor for upward moves in the price center. To make this call, we need to evaluate inventory buffers, demand continuity, and marginal development costs simultaneously.
Condition one: The buffer from earlier supply expansion gradually wears down, and high prices can no longer quickly induce enough new output, dropping effective supply elasticity.
After large project commissions, slower mine supply growth usually means less momentum from previous project reserves.
In this context, strikes, transport interruptions, and policy changes are more likely to disrupt prices; if such disturbances further delay investment or raise project return requirements, their impact can shift from short-term risk premiums to long-term supply cost increases.
Moreover, although strong supply release tends to cap copper prices, given monetary and inflation factors, nominal copper prices don’t necessarily fall. The experience of 1969—1974 shows that changes in the nominal price center can, in extreme cases, also be impacted by monetary shocks.
Condition two: A sharp demand slowdown may delay the central price upturn; there must be sustained, low price-elastic marginal demand.
Demand must continue to absorb supply, not just cause short-term restocking.
Experience from 1974 through the mid-1980s shows that slower supply growth does not guarantee an immediate upward shift in the central price level. Economic recessions, demand adjustments, and inventory absorption can keep the market loose for extended periods.
The post-2002 shift reflects China’s industrialization and urbanization creating lasting new demand, gradually absorbing prior capacity expansions.
Condition three: To meet new demand, marginal resources must be developed at higher costs and capital returns.
Only continuous discovery of large, low-cost supplies via technological advancement and new resources can suppress marginal supply prices.
Chile’s large mine and SX-EW expansions in the 1990s did boost supply and resource economics, but did not permanently prevent upward shifts in the central copper price. Once new production was absorbed, the market still needed to develop the next batch of resources.
Since 2021, the core change is the slowdown in supply following the supercycle’s project commissioning and simultaneous growth in power and electrification-driven demand.
Supply-side constraints are mainly reflected in increased difficulty converting resources into effective output globally; the mining industry has not returned to a persistent ~5% high-growth cycle.
On the demand side, a weakening real estate sector does not necessarily mean total copper demand contracts simultaneously; structural demand is picking up where legacy physical investment left off. Power grid builds, transport electrification, and energy system investments are providing a new source of demand beyond the traditional real-estate-driven cycle.
The IEA pointed out in its 2025 report that China’s power grid expansion was the largest single contributor to global copper demand growth over the past two years. This implies that demand growth is following real physical investment, rather than relying solely on long-term narratives.
2017 was the point when conditions for the central price level to move higher first emerged; since 2021, supporting evidence has become stronger. Weak supply explains why prices don't drop back to previous lows; structural demand determines whether prices can break from old platforms, and higher marginal incentive costs determine the height and sustainability of the new price platform.