
Liquidation Panic Overshadows U.S. Bond Rebound, $4,000 Gold Price Level in Jeopardy

Huitong Network, October 23 — Despite a sell-off in US tech stocks driving the 10-year US Treasury yield down around 17 basis points to 4.96%, gold prices briefly fell below $4,000. The conventional correlation between interest rates and gold prices has failed, reflecting liquidity and position pressures, and even potential forced liquidation scenarios. After gold prices broke below the $4,066.21 support, the market immediately focused on the $3,942–$3,924 range; if the sell-off intensifies, gold could further decline to the $3,750 level.
This round of gold price declines has exposed a rare divergence among traditional safe-haven assets. The tech-led equity sell-off drove capital inflows into US Treasuries, pushing the 10-year yield down about 17 basis points to 4.96%, but gold prices continued to weaken, temporarily breaking below $4,000. Even inflation-adjusted real yields on Treasuries have fallen; however, the support for gold prices that should come from falling real interest rates has not materialized. 
This contrast indicates that liquidity and position pressures have overwhelmed gold’s traditional sensitivity to rates; so far, however, there is no independent evidence confirming forced liquidations in the market.
From a technical perspective, the breakdown of gold below $4,066.21 signals the resumption of the downward trend starting from the high of $4,697.07, with a possible fifth wave of decline underway. The key support to watch is the $3,942–$3,924 range, where gold has an initial chance of rebounding. However, if this range is decisively broken, the target moves down to around $3,750. Whether the Nasdaq Composite can hold support near 25,803 and the 10-year Treasury yield stays below 5% are crucial signals to determine whether this round of cross-asset safe-haven adjustment will deteriorate or stabilize.
On Thursday, the tech sell-off intensified and gold prices extended their decline, briefly dropping below the psychological $4,000 mark, with an intraday low close to $3,986. Silver fell even more, dragged down by concerns over industrial demand and economic growth prospects. The weakness in precious metals contrasts sharply with the strength in US Treasuries: safe-haven buying poured into government bonds, driving yields down significantly.
This divergence is especially noteworthy: nominal Treasury yields fell while real yields also retreated. The 10-year nominal Treasury yield dropped from about 5.13% to 4.96%, with the corresponding inflation-adjusted real yield going from 2.76% down to 2.64%.
Generally, a decline in real yields lowers the opportunity cost of holding zero-yielding assets like gold. But gold has not benefited, indicating that other selling pressures are dominating short-term gold price moves.
The timing is also notable: gold’s decline began before the Treasury rally, suggesting the initial sell-off can't be simply attributed to liquidity pressure from the later equity slide. Nevertheless, gold remained weak even as real yields fell, reflecting that the traditional interest-rate pricing logic has lost its previous supporting effect.
AI sector sell-off triggers safe-haven Treasury buying
Investors have begun to question the scale of capital required for large-scale AI investment and the potential returns, leading to another severe blow to US tech stocks. On Thursday, the Nasdaq Composite fell about 2.6%, marking the largest single-day drop since June; the S&P 500 fell about 1.2%. Chip stocks such as Nvidia led losses, and tech selling pressure had previously spread to Asian and European markets.
The market's core focus has shifted: it's no longer whether AI investment generates revenue growth, but whether massive capital expenditures can create enough returns. Recent earnings reports have not settled this debate, so investors are particularly sensitive about corporate guidance and capital needs. As tech stocks weaken, demand for US Treasuries as a safe haven rises, pushing down yields.
Rising Treasuries reflect a search for safety, but gold hasn't risen in tandem. This divergence shows investors are operating in very different ways—buying government bonds for safety while reducing exposure to other liquid positions to control portfolio risk overall. This suggests the latest market reaction is not just an adjustment of interest rate expectations.
Liquidity-driven selling is a reasonable explanation for gold’s abnormal weakness. When stock markets fall, leveraged investors face floating losses, margin calls, or tightened risk controls, forcing them to quickly raise cash. With its superior liquidity, gold is often sold to realize cash, even if its long-term investment value remains.
HSBC has pointed out that forced margin liquidations may weaken gold’s short-term role as a hedge against equity declines; Invesco also reminds that during periods of financial pressure, investors tend to sell profitable gold positions to meet liquidity needs.
The recent price action aligns with this logic: both nominal and real Treasury yields fell, yet gold and tech stocks weakened together. A technical break of support can trigger further position reductions, amplifying the decline. However, the scale of forced selling is not verifiable at this time. Real-time data such as ETF flows, futures trading, and margin reports are still insufficient to determine how much of Thursday’s gold price drop was due to leveraged liquidations.
Looking at recent speculative positioning, CFTC data shows that as of October 13, asset managers’ net long position in COMEX gold futures had fallen from around 127,400 contracts at the end of September to 107,100 contracts. This indicates that long positions were already being reduced before the recent sharp fall. However, these figures do not include Thursday's trading data, so it is unknown whether liquidations have accelerated since then.
The available evidence points more toward liquidity and position pressures temporarily overwhelming a rate environment that should be favorable to gold, rather than supporting forced liquidations as the main driver of the current downturn.
Gold prices broke below the $4,066.21 support, confirming the resumption of the downtrend from the $4,697.07 peak. Per the current Elliott Wave structure, the decline from $4,198.93 marks the fifth wave down after a failed rebound. The 4-hour and daily charts show prices under pressure below the 55-period EMA (4-hour EMA around $4,124, daily EMA around $4,231).
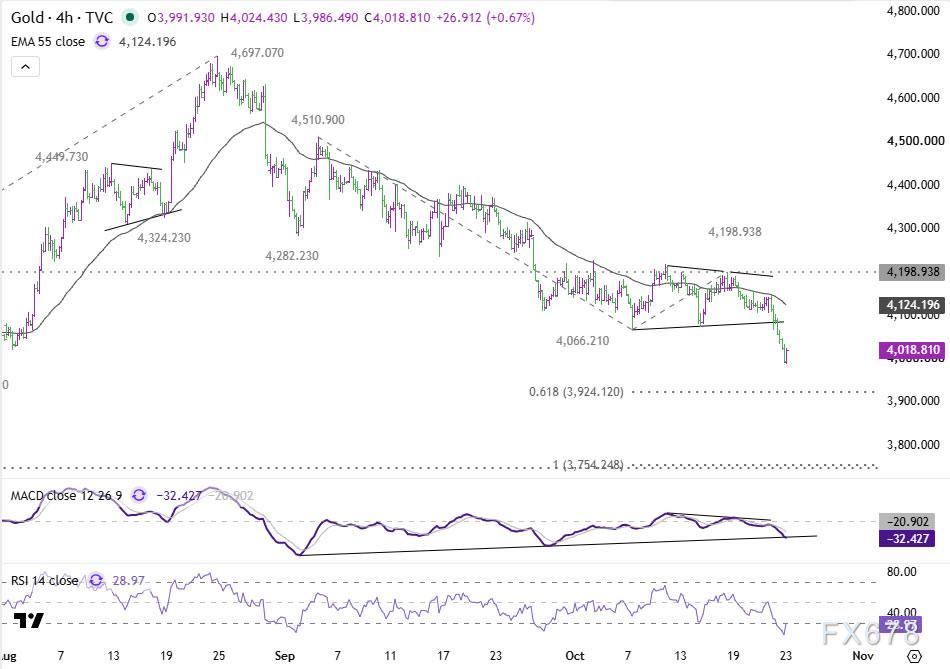
(Spot gold 4-hour chart)
First downside target: calculated from $4,198.93, the 61.8% Fibonacci extension of the $4,510.90–$4,066.21 swing lies at $3,924.12. This level is slightly below the previous low of $3,942.43, forming a key support zone at $3,924–$3,942. With the 4-hour RSI approaching 29, selling momentum is already oversold, so a technical rebound in this area is not surprising. As long as resistance at $4,198.93 is not breached, the short-term trend remains bearish.
If gold prices decisively break $3,924.12, the decline will accelerate, aiming for the 100% extension at $3,754.24. This coincides with the daily chart’s major extension target ($3,748–$3,749) and the lower boundary of the medium-term descending channel. The convergence of multiple technical levels means $3,748–$3,754 could be an important bottom region, provided the current downtrend extends that far.
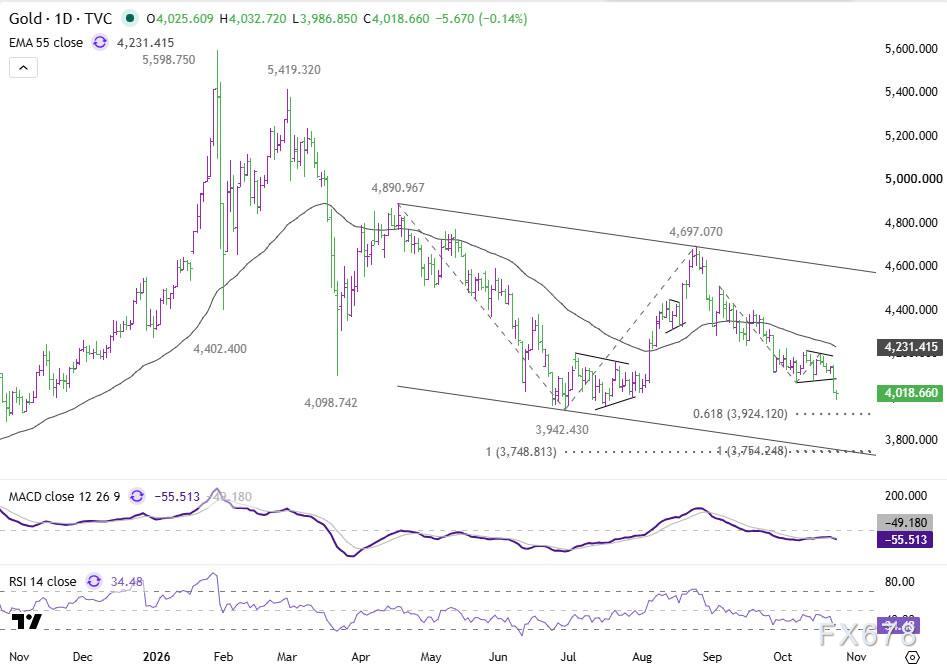
(Spot gold daily chart)
Outside the gold market, two key indicators help judge whether underlying market stress is continuing to worsen. On Thursday, the Nasdaq index dropped to 26,009, nearing the important structural support of 25,802.96. Continued breakdown below this level would signal further stock market losses, with the next target being the 38.2% retracement of the 20,690.25–27,722.75 upswing, around 25,036.35. While a deeper equity sell-off increases portfolio risk pressure, a purely technical breakdown does not necessarily trigger a new wave of forced liquidations.
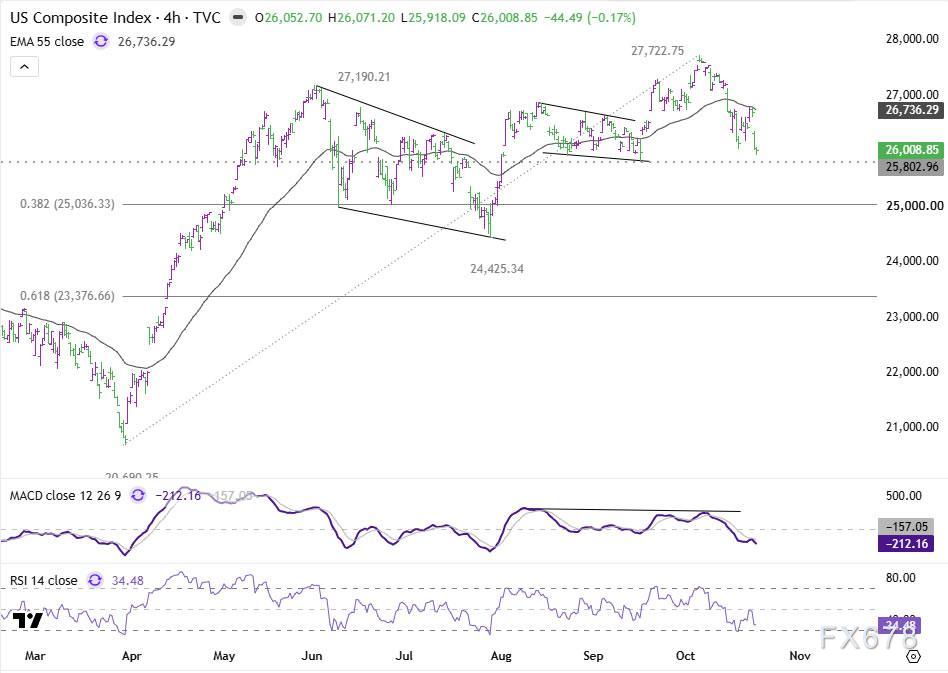
(10-year US Treasury yield 4-hour chart)
Meanwhile, the 10-year US Treasury yield has retreated to around 4.975% near the daily 55 EMA, already below the 5% psychological mark. If yields continue to fall, the next step will target the 38.2% retracement of the 3.926%–5.365% rally, approximately 4.815%. Conversely, if yields reclaim 5% while stocks stabilize, Treasury safe-haven buying may subside.
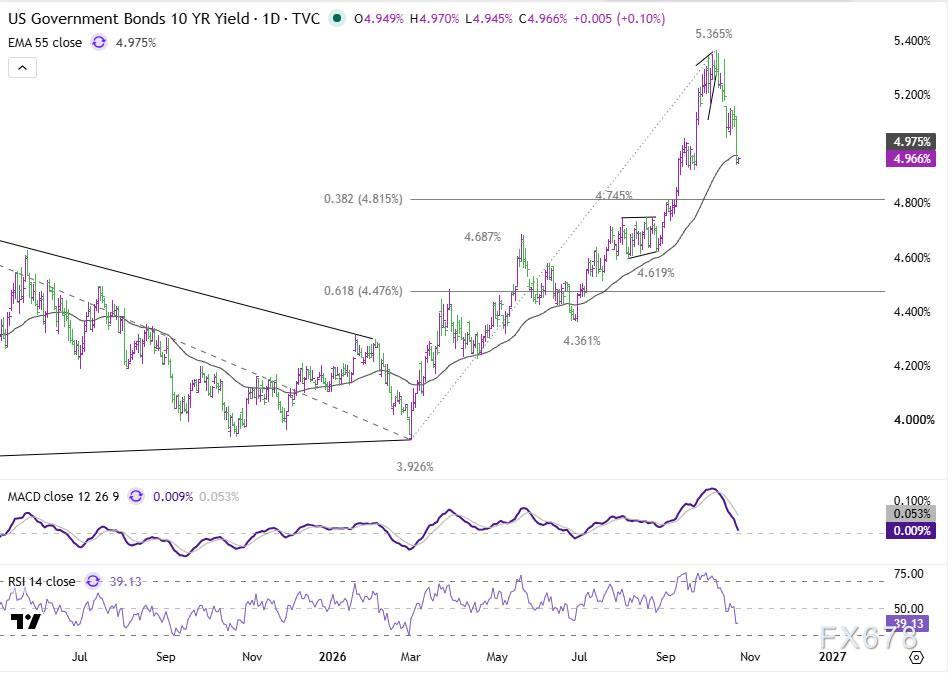
(10-year US Treasury yield daily chart)
The most cautionary signal: Nasdaq breaking support while Treasury yields keep falling. If gold remains weak under such conditions, it further supports the case that liquidity and position pressures are overpowering gold’s traditional rate-driven pricing logic. Conversely, if equities stabilize and safe-haven Treasury demand cools, the momentum behind safe-haven rotation should ease and gold selling pressure may subside.
Currently, the inability of falling real yields to lift gold prices remains a core market signal. The magnitude of leveraged liquidations is still uncertain; after a technical breakdown, the market is focused on the $3,924 support. If selling accelerates further, the risk of a deep gold plunge toward $3,748–$3,754 rises significantly.
Disclaimer: The content of this article solely reflects the author's opinion and does not represent the platform in any capacity. This article is not intended to serve as a reference for making investment decisions.
You may also like
Cboe Clear’s SEC registration lets the clearinghouse handle securities

Newmont prices Red Chris expansion at up to $4.8B
Ascend Markets and M1X Global complete first Stellar-based repo with US Treasury bonds

Chevron uses Permian playbook to breathe life into Argentina’s ‘Dead Cow’ oil region


