
Bitget App
Trade smarter
MarketsTradeFuturesStocksEarnInstitutionAI & More
Dogecoin Price Analysis: DOGE Enters Final Stage of Multi Year Triangle

Dogecoin Price Analysis: DOGE Enters Final Stage of Multi Year Triangle

CryptoNewsNetCryptoNewsNet2026/05/24 15:45
By:CryptoNewsNet
Back to the list

Dogecoin Price Analysis: DOGE Enters Final Stage of Multi Year Triangle

  coinpaper.com 17 m
Dogecoin Price Analysis: DOGE Enters Final Stage of Multi Year Triangle image 0

Dogecoin is moving deeper into a long term compression zone, with both price and market cap charts showing pressure near key resistance. $DOGE still needs a confirmed breakout, but the narrowing structure shows that the next major move may be getting closer.

Dogecoin Price Chart Shows Large Pennant as $DOGE Compresses

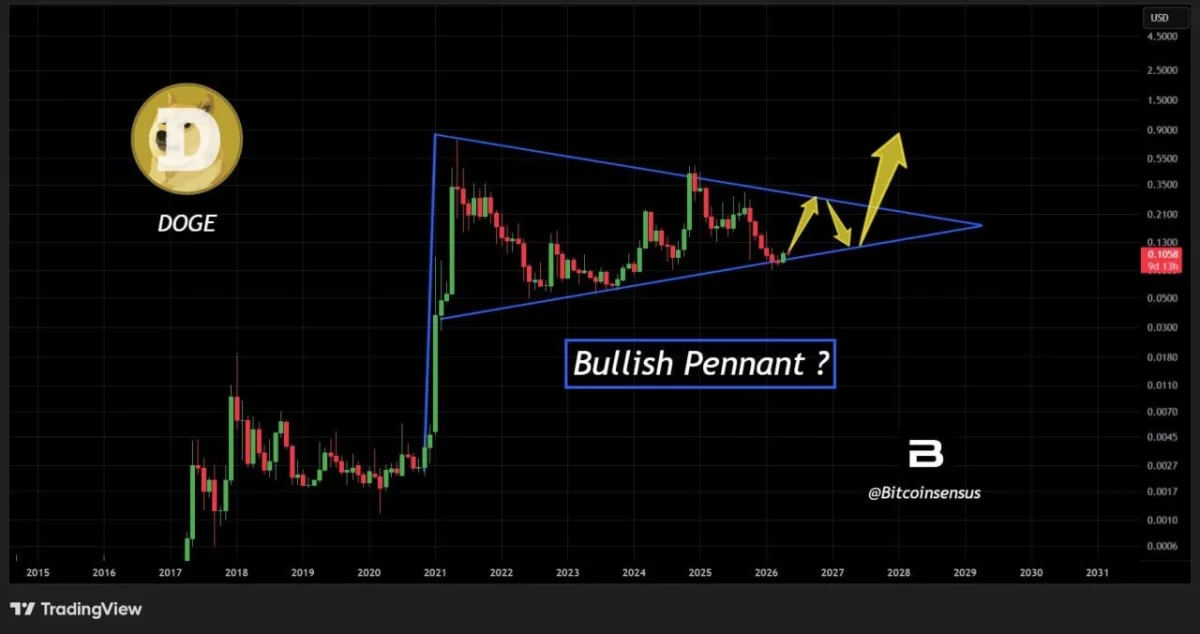
Dogecoin is moving inside a large long term pennant structure after its major impulse move, according to a chart shared by Bitcoinsensus on X.

The chart shows $DOGE forming lower highs and higher lows inside a narrowing triangle. This type of setup usually shows compression, where price moves into a smaller range before a larger move develops.
Dogecoin Price Analysis: DOGE Enters Final Stage of Multi Year Triangle image 1

$DOGE Long Term Chart. Source: Bitcoinsensus on X

The upper blue trendline has acted as resistance since the post rally peak. Each rejection from that line has kept $DOGE inside the structure. A clean move above that trendline would be the first sign that buyers are trying to regain control.

The lower blue trendline remains the key support area. $DOGE has held that rising support several times since the 2022 low. If price loses that line, the pennant structure would weaken and the bullish setup would become less reliable.

The chart also marks a possible path where $DOGE breaks higher after one more pullback inside the pattern. However, the breakout still needs confirmation. Without a strong candle above resistance, $DOGE may continue moving inside the narrowing range.

For now, the main signal is compression. $DOGE has not confirmed a breakout yet, but the long term chart shows price approaching the point where the pennant structure may decide the next larger move.

Dogecoin Market Cap Chart Shows Breakout Pressure Near Apex

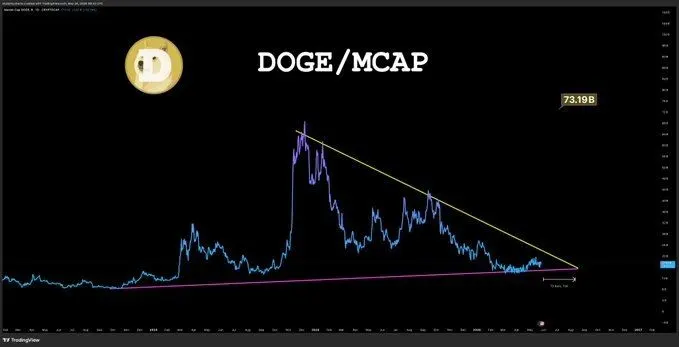
Dogecoin market cap is compressing near the end of a long term triangle structure, according to a chart shared by DonWedge on X.

The chart shows $DOGE market cap moving under a descending resistance line that started after the 2021 peak. At the same time, a rising support line has held the lower side of the structure for several years.
Dogecoin Price Analysis: DOGE Enters Final Stage of Multi Year Triangle image 2

$DOGE Market Cap Chart. Source: DonWedge on X

This setup shows a tightening range. $DOGE has not confirmed a breakout yet, but the chart suggests that pressure is building as price action moves closer to the triangle apex.

A clean move above the yellow resistance line would be the first stronger bullish signal. The chart marks a possible upside target near $73.19 billion in market cap if buyers push $DOGE out of the structure.

However, $DOGE still needs confirmation. Without a breakout above resistance, the market cap could continue moving sideways near the apex or retest the rising support line.

The key risk sits at the lower purple trendline. If $DOGE loses that support, the long term compression setup would weaken and the bullish breakout case would lose strength.

For now, the chart shows $DOGE holding inside a major multi year structure. The next larger move depends on whether buyers can break the descending resistance line with follow through.


0
0

Disclaimer: The content of this article solely reflects the author's opinion and does not represent the platform in any capacity. This article is not intended to serve as a reference for making investment decisions.

You may also like

CoreWeave default probability exceeds 60%! Jensen Huang "puts out the fire": Financing costs are declining, no need for NVIDIA to backstop

After Jensen Huang's speech, CoreWeave's stock price, which had fallen by as much as 9.5% in early trading, turned positive. The company's five-year CDS rose above 1,190 basis points during Thursday’s session, a historical high reflecting the cost of debt default protection, while yields on some of its corporate bonds have climbed above 15% to 16%. The five-year CDS spreads for Oracle, Amazon, Google’s parent company, and Meta are all at historically high levels. Deutsche Bank analysts believe that as the AI capital expenditure cycle is increasingly supported by debt rather than free cash flow, investors must place greater emphasis on signals from the credit market. Overall, while AI-related financing costs are not yet excessively high, worrying signs have begun to emerge.

华尔街见闻•2026/10/15 21:36
CoreWeave default probability exceeds 60%! Jensen Huang "puts out the fire": Financing costs are declining, no need for NVIDIA to backstop

Wall Street is wary of Bessent making another move to suppress yields; key clues may emerge this Friday

This Friday, major primary dealers of government bonds will receive the U.S. Treasury's routine survey before the refinancing announcement is released. Citigroup expects the survey may hint at a reduction in long-term bond issuance, or even the cancellation of 20-year U.S. Treasury bonds. Morgan Stanley emphasizes: "The next two refinancing announcements will be crucial, especially the one in November, which comes right after the midterm elections."

华尔街见闻•2026/10/15 21:06

Risk aversion outweighs inflation concerns, US and European government bonds rise across the board, US Treasury yields plunge more than 10 basis points intraday

Investors concerned about rising inflation are shifting their focus to the potential impact of high borrowing costs on economic growth. Some commentators have linked the recent decline in U.S. Treasury yields to surging financing costs for AI-related companies, suggesting that pressure in the technology stocks and AI infrastructure sectors is driving funds toward safe-haven assets such as government bonds.

华尔街见闻•2026/10/15 20:27
Risk aversion outweighs inflation concerns, US and European government bonds rise across the board, US Treasury yields plunge more than 10 basis points intraday