QuantumScape stock gains 7.63%, but stays below all three daily EMAs
QuantumScape stock retains a bearish daily bias despite a session gain of 7.63% from the previous close. Shorter-term signals are more constructive, but the price remains below all three daily exponential averages. That leaves the bullish case conditional on clearing overhead resistance.
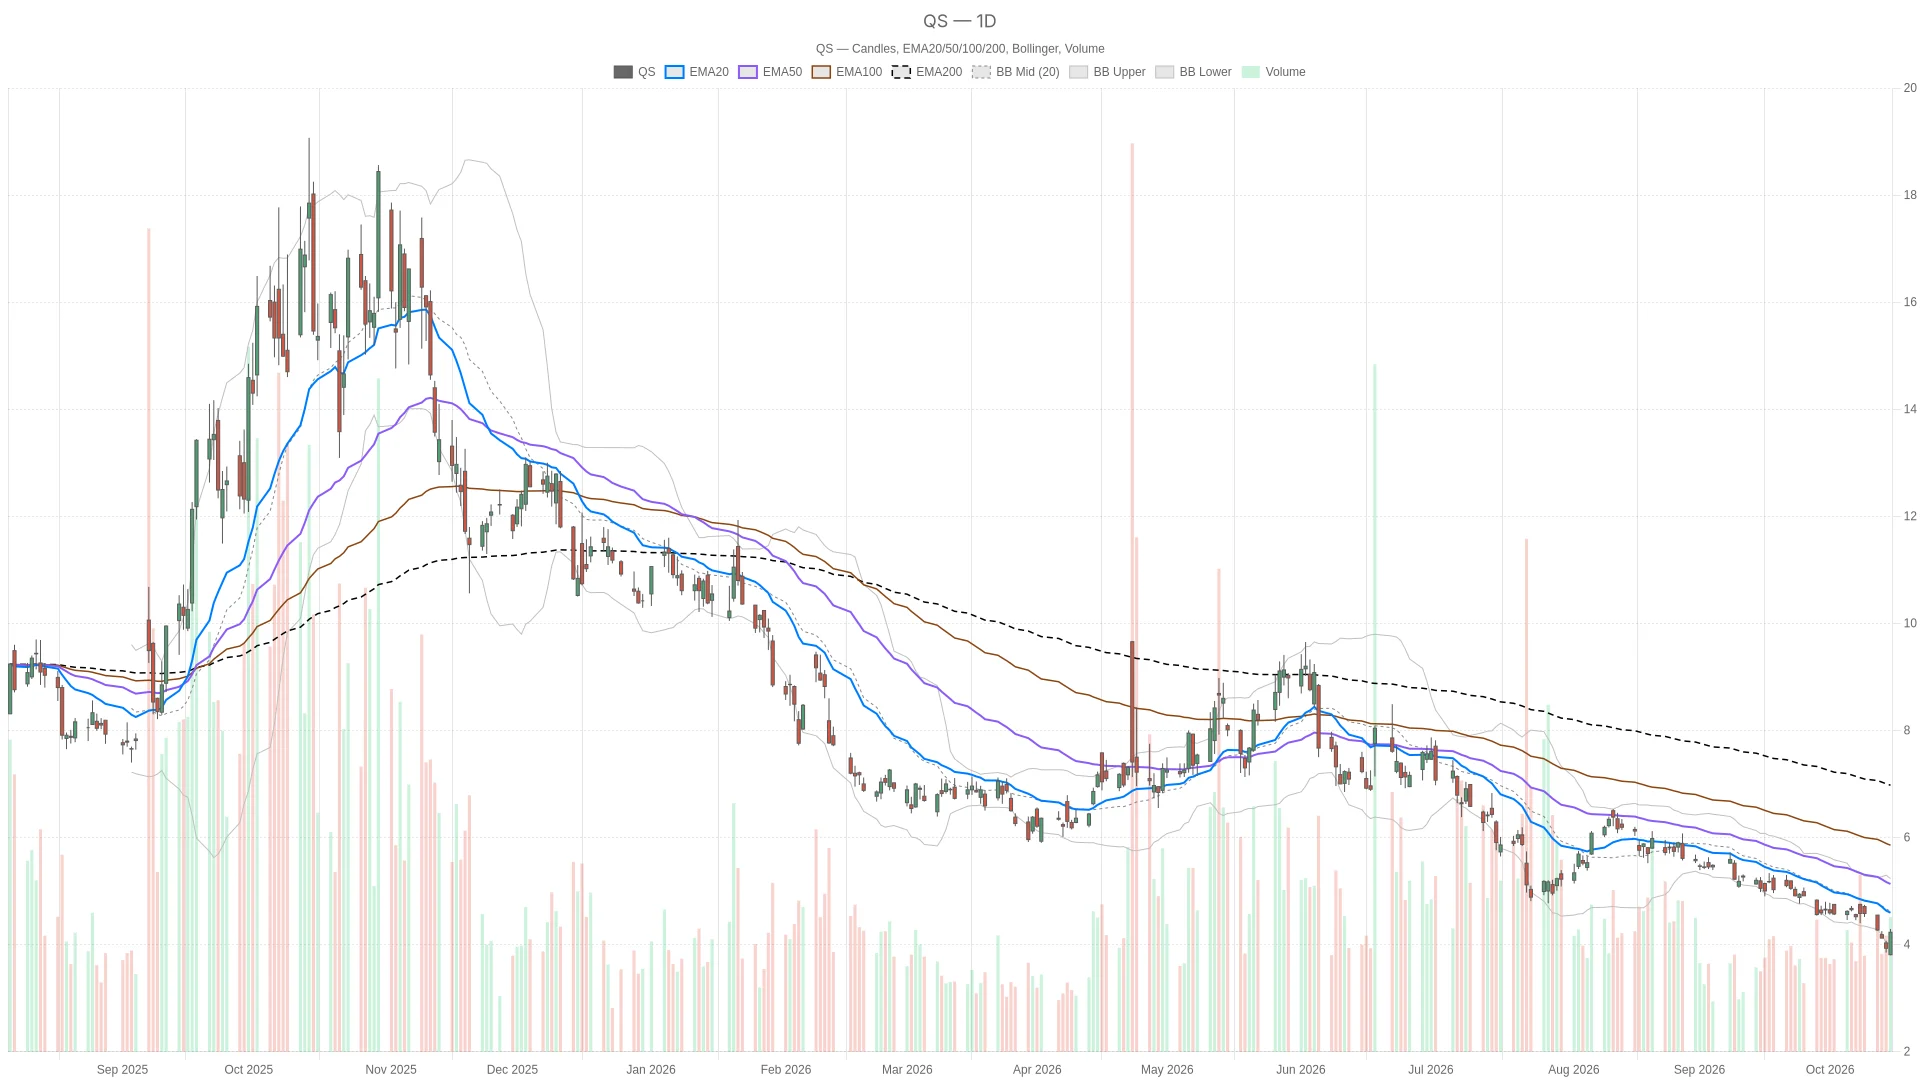 QS — daily chart with candlesticks, EMA20/EMA50 and volume.
 Summary
Key takeaways
- QuantumScape stock closed at $4.23 on Thursday, October 15, 2026, up 7.63% from the previous close of $3.93.
- The daily trend structure is bearish: price sits below the 20-session EMA at $4.59, the 50-session EMA at $5.13, and the 200-session EMA at $6.82.
- Daily RSI14 rose to 34.95 from 21.97, exiting oversold territory but remaining below the neutral 50 level.
- Hourly RSI14 is 56.6, above 50, and the hourly MACD line at -0.04 sits above its signal at -0.09.
- The daily pivot for the next session is $4.11, with first resistance at $4.41 and first support at $3.92. Hourly and 15-minute first supports both sit at $4.20.
On Thursday, October 15, 2026, QS opened at $3.81 and closed at $4.23. The session ranged from a low of $3.80 to a high of $4.29. The previous close was $3.93 on October 14, 2026.
QuantumScape stock faces a bearish daily structure
QuantumScape stock remains in a bearish daily structure. The price closed at $4.23, below all three daily exponential averages.
The daily averages are bearishly aligned. Price sits below the 20-session EMA at $4.59, the 50-session at $5.13, and the 200-session at $6.82. This ordering keeps the primary trend assessment bearish, notwithstanding the positive session.
However, daily RSI14 rose to 34.95 from 21.97. It is no longer oversold but remains below 50.
The daily MACD line is -0.3, below its signal at -0.27, with a negative histogram of -0.03. That leaves daily momentum on the bearish side of the signal line.
Meanwhile, the daily Bollinger lower band is $4.01, the mid-band is $4.62, and the upper band is $5.23. Price sits between the lower and mid-band, leaving the middle of that envelope overhead.
Daily ATR14 increased to $0.26 from $0.24. This represents a larger absolute volatility measure than in the preceding daily candle.
Hourly signals complicate the daily view
The hourly chart presents a mixed picture rather than a clear bullish signal. Price holds above the 20-period EMA but remains below both the 50-period and 200-period averages.
In contrast to the daily structure, price sits above the hourly 20-period EMA at $4.12. However, it remains below the 50-period at $4.26 and the 200-period at $4.79. The hourly chart therefore offers partial support for a bullish case, not a fully bullish average alignment.
Hourly RSI14 slipped to 56.6 from 58.07, while remaining above 50. The hourly MACD histogram is 0.05. Its line at -0.04 is above the signal at -0.09, supporting the positive short-term reading despite both lines being negative.
Notably, price is above the hourly Bollinger mid-band at $4.06 and below the upper band at $4.31. These positions contrast with the daily chart, where the mid-band remains overhead. The disagreement favors caution about treating hourly strength as a change in the primary trend.
Short-term timing and the news backdrop
The 15-minute chart offers execution references but no grounds to override the daily bearish bias. Price sits above the 20-period and 50-period EMAs but below the 200-period EMA.
On the 15-minute chart, price is above the 20-period EMA at $4.14 and the 50-period EMA at $4.09. However, it remains below the 200-period EMA at $4.27. RSI14 is 64.8 and is below the overbought threshold. The MACD line at 0.06 exceeds its signal at 0.05, with a positive histogram of 0.01. Price also sits between the Bollinger mid-band at $4.15 and the upper band at $4.26. These are execution references, not grounds to override the daily bias.
Separately, a report published on October 9, 2026, described QuantumScape’s introduction of QS PowerBlock for AI data-center storage. The modular solid-state lithium-metal battery system is intended to fit existing rack architectures. That product context does not establish a cause for the session’s price move.
Bullish and bearish conditions for the next session
For the next session, the daily pivot at $4.11 combines with first resistance at $4.41 and first support at $3.92. The hourly pivot is $4.25, with first resistance at $4.27 and first support at $4.20. The 15-minute pivot is $4.24, with first resistance at $4.26 and first support at $4.20. Each set comes from its timeframe’s last completed candle.
Bullish scenario
The bullish scenario requires holding the hourly and 15-minute first supports at $4.20. Clearing the 15-minute pivot at $4.24 and hourly pivot at $4.25 would provide initial support. The next hurdles are $4.26–$4.27 across the short-term resistance levels, followed by the hourly upper Bollinger band at $4.31. Beyond those, daily first resistance at $4.41 precedes the 20-session EMA at $4.59 and the daily Bollinger mid-band at $4.62.
Bearish scenario
Conversely, a break below $4.20 would undermine that short-term bullish setup. Below it, the daily pivot at $4.11 and the daily lower Bollinger band at $4.01 become relevant references. A break beneath daily first support at $3.92 would invalidate the support-holding premise of the bullish case.
Overall, QuantumScape stock stands above the next-session daily pivot but below its daily exponential averages. Daily ATR14 is $0.26, while the hourly and 15-minute readings are $0.08 and $0.04. The unresolved question is whether positive shorter-term signals can support a break through resistance without losing nearby support.
FAQ
What is the daily trend structure for QuantumScape stock?
QuantumScape stock closed at $4.23, below the 20-session EMA at $4.59, the 50-session EMA at $5.13, and the 200-session EMA at $6.82. The daily MACD line at -0.3 sits below its signal at -0.27, and daily RSI14 at 34.95 is below 50.
What are the key levels to watch for the next session?
The daily pivot is $4.11, with first resistance at $4.41 and first support at $3.92. On the hourly chart, the pivot is $4.25 with first resistance at $4.27 and first support at $4.20. The 15-minute pivot is $4.24, with first resistance at $4.26 and first support at $4.20.
Are the hourly signals bullish or bearish?
The hourly signals are mixed. Price sits above the 20-period EMA at $4.12 but below the 50-period at $4.26 and the 200-period at $4.79. Hourly RSI14 at 56.6 is above 50, and the MACD line at -0.04 is above its signal at -0.09.
{"@context":"https://schema.org","@type":"FAQPage","mainEntity":[{"@type":"Question","name":"What is the daily trend structure for QuantumScape stock?","acceptedAnswer":{"@type":"Answer","text":"QuantumScape stock closed at $4.23, below the 20-session EMA at $4.59, the 50-session EMA at $5.13, and the 200-session EMA at $6.82. The daily MACD line at -0.3 sits below its signal at -0.27, and daily RSI14 at 34.95 is below 50."}},{"@type":"Question","name":"What are the key levels to watch for the next session?","acceptedAnswer":{"@type":"Answer","text":"The daily pivot is $4.11, with first resistance at $4.41 and first support at $3.92. On the hourly chart, the pivot is $4.25 with first resistance at $4.27 and first support at $4.20. The 15-minute pivot is $4.24, with first resistance at $4.26 and first support at $4.20."}},{"@type":"Question","name":"Are the hourly signals bullish or bearish?","acceptedAnswer":{"@type":"Answer","text":"The hourly signals are mixed. Price sits above the 20-period EMA at $4.12 but below the 50-period at $4.26 and the 200-period at $4.79. Hourly RSI14 at 56.6 is above 50, and the MACD line at -0.04 is above its signal at -0.09."}}]}
Article produced with the assistance of artificial intelligence and reviewed by the editorial team.





