
Weekly Market Outlook: Gold Breaks Below $4,000, US500 Diverges Near Highs—How Will AI Selling Pressure Reshape CFD Markets?
This week, global markets are being driven by four key themes: inflation, interest rates, AI, and liquidity.
On one side, gold has slipped below $4,000 per ounce, signalling that markets are repricing the risk of interest rates staying higher for longer. On the other, the S&P 500 remains close to record highs, yet clear divergence has emerged beneath the surface: a small group of large technology stocks continues to support the index, while a much larger number of constituent stocks remain in correction territory.
At the same time, growing concerns over returns on AI-related capital expenditure have triggered a sell-off in technology shares and forced hedge funds to deleverage. The market is shifting away from a simple “growth narrative” toward a more practical test: Can corporate earnings justify elevated valuations? And will persistent inflation force the Federal Reserve to keep rates high for longer?
For CFD traders, this means the focus this week should not be limited to market direction. They should also be prepared for potentially accelerating volatility.
Gold Falls Below $4,000: The Market Is Trading Rate Risk, Not Just Safe-Haven Demand
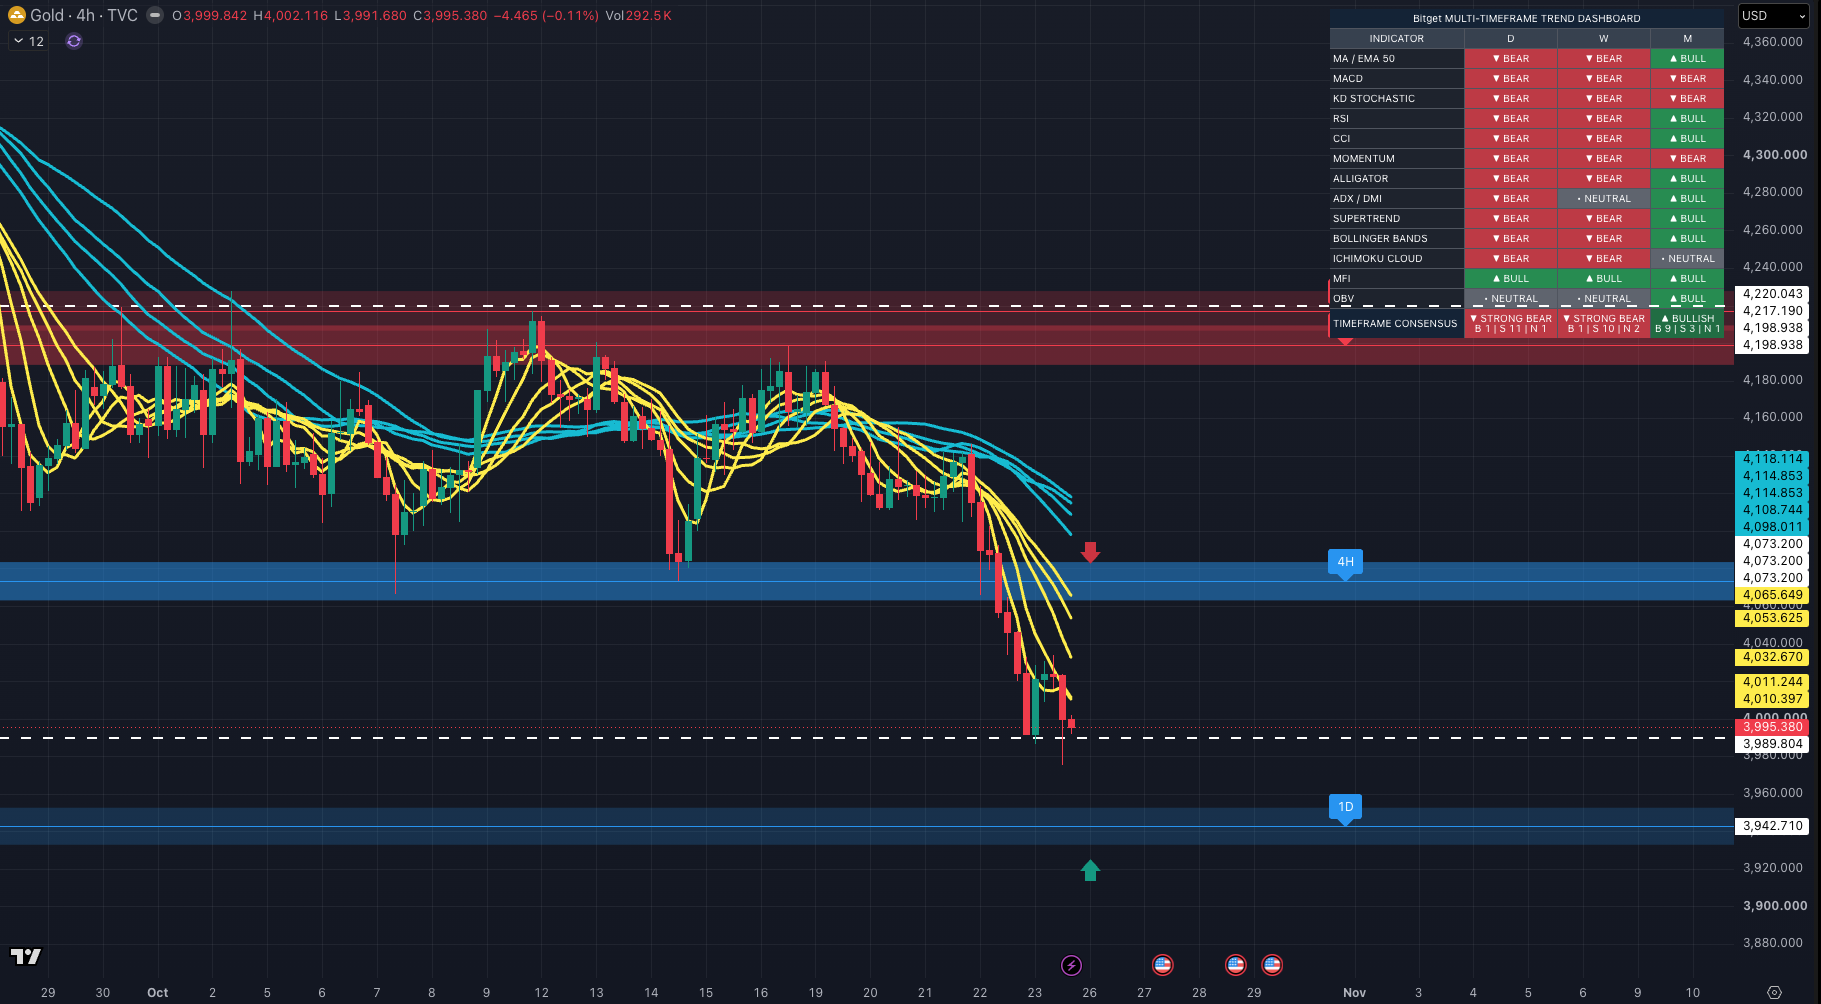
Gold bulls have come under notable pressure in recent sessions. Spot gold briefly fell to $3,975.23 per ounce, marking its first break below the $4,000 psychological level since mid-July. It later closed near $3,998, down around 4% for the week—its worst weekly performance since June.
The loss of $4,000 is more than a technical breakdown. It also reflects a shift in market sentiment.
Previously, gold had benefited from expectations of rate cuts, geopolitical risks, and safe-haven demand. However, rising energy prices and firmer-than-expected inflation data are prompting markets to reconsider whether the Federal Reserve can ease policy as quickly as previously anticipated.
This is the key factor currently weighing on XAUUSD.
Why Has Rising Oil Not Immediately Supported Gold?
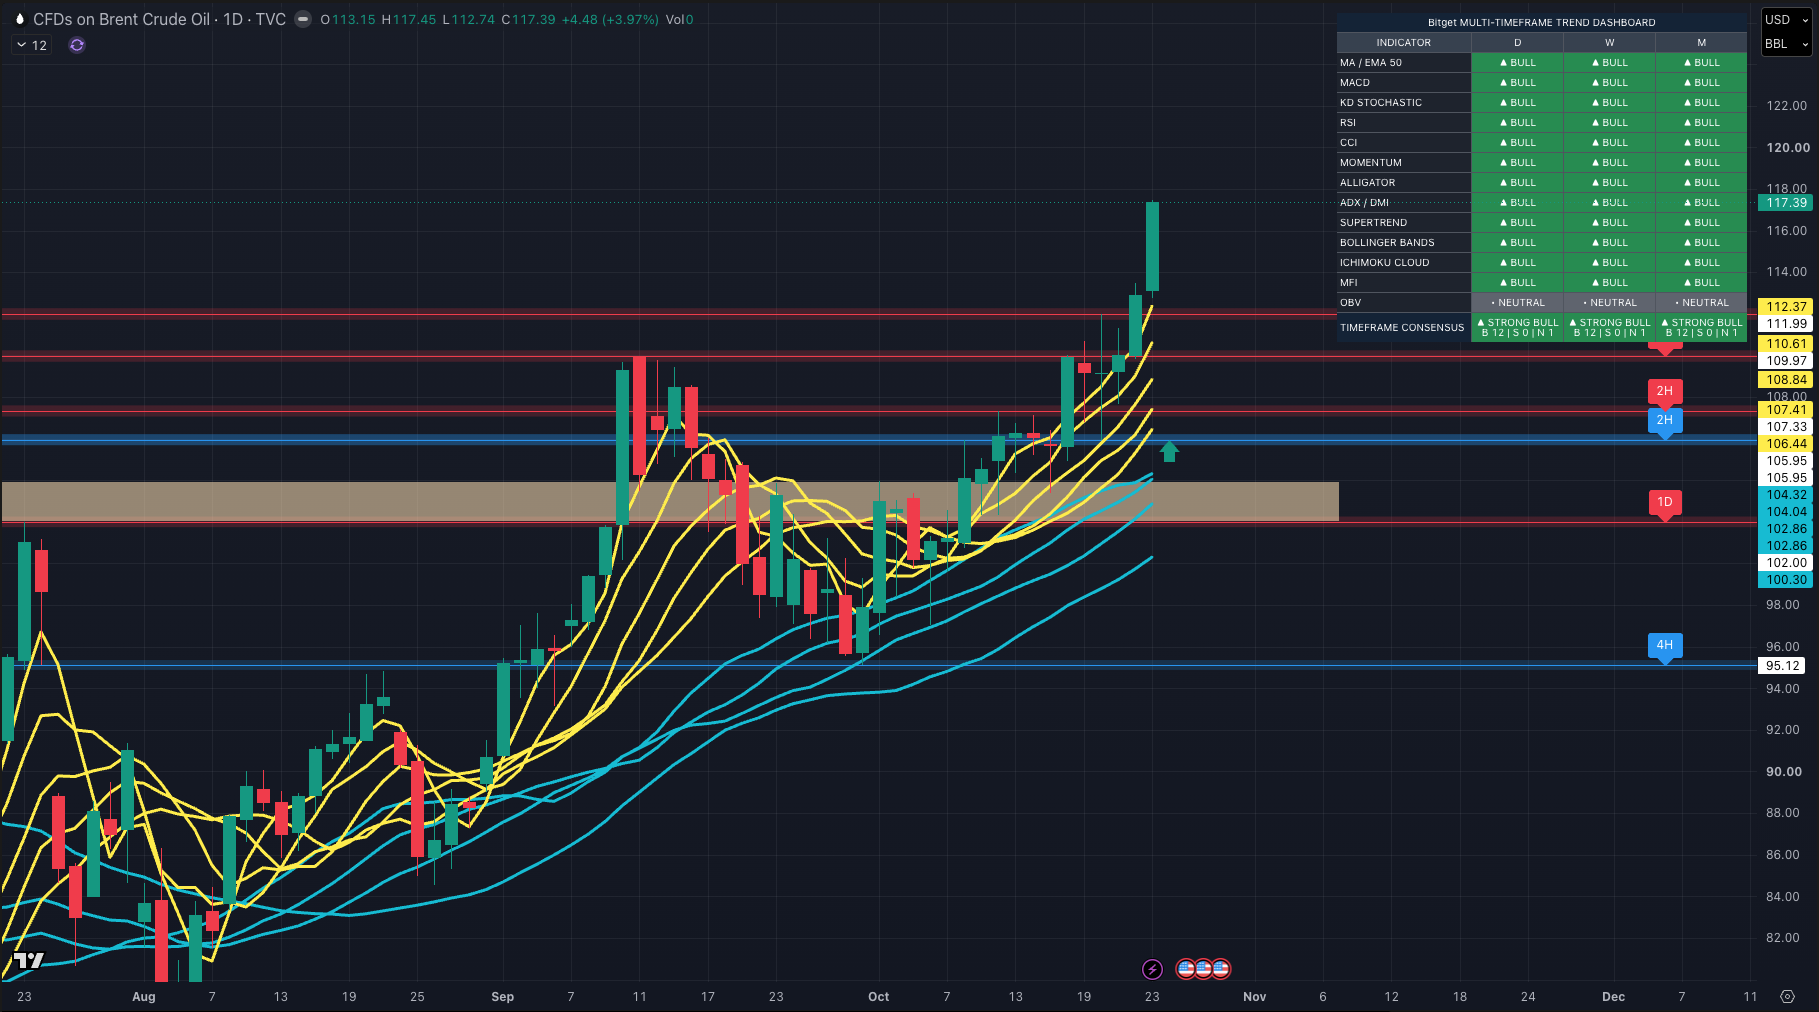
In theory, gold is often viewed as an inflation hedge. However, in the current environment, higher oil prices are creating short-term pressure on gold because markets are more focused on the policy consequences of inflation.
If energy prices remain elevated, transportation, manufacturing, and consumer costs may all rise, increasing the persistence of inflation. When markets become concerned that inflation could remain sticky, the US dollar and Treasury yields often strengthen as investors price in the possibility that the Federal Reserve will need to maintain restrictive policy for longer.
For gold, the issue is not inflation alone. The key risks are:
-
Rising inflation may push the Fed toward a more hawkish stance;
-
Higher interest rates increase the opportunity cost of holding non-yielding assets;
-
A stronger US dollar and higher Treasury yields typically limit gold’s upside potential.
As a result, gold is currently caught in a familiar macroeconomic tug-of-war: safe-haven demand provides support, while interest-rate pressure weakens upside momentum.
XAUUSD Focus This Week: Can Gold Reclaim $4,000?
For XAUUSD traders, $4,000 remains the most important level to watch this week.
If prices can quickly move back above $4,000, it may suggest that dip-buying interest remains intact. In that case, the recent break below the level could prove to be a short-term shakeout or a false breakdown triggered by macroeconomic news.
Conversely, if gold remains capped below $4,000 and breaks beneath the short-term low near $3,975, bearish momentum may not be over, and the market could begin searching for lower support levels.
Traders should pay particular attention to the following catalysts:
1. PCE Price Index
PCE is one of the Fed’s most closely watched inflation indicators. If the reading exceeds expectations, markets may further price in a higher-for-longer rate environment, potentially increasing volatility in XAUUSD.
2. US Dollar Index and Treasury Yields
If the dollar and yields rise together, gold rebounds may remain limited. If both decline, gold could find room for a relief move.
3. Oil Prices and Middle East Supply Risks
Continued strength in oil could keep inflation concerns elevated. However, an escalation in geopolitical risks could also revive safe-haven demand for gold.
4. Fed Commentary and Changes in Rate Expectations
Markets broadly expect the Fed to keep rates unchanged in the near term, but investors are more focused on the policy outlook ahead. As long as expectations for rates to stay higher for longer continue to rise, gold may remain under pressure.
That said, gold is not without support. Physical demand from key consumer markets such as India and China has continued to emerge on price pullbacks. This means that while physical demand may help limit the downside, it may not be enough to immediately reverse a short-term market driven primarily by interest-rate expectations.
US500 Near Highs, but the Market May Be Weaker Than It Appears
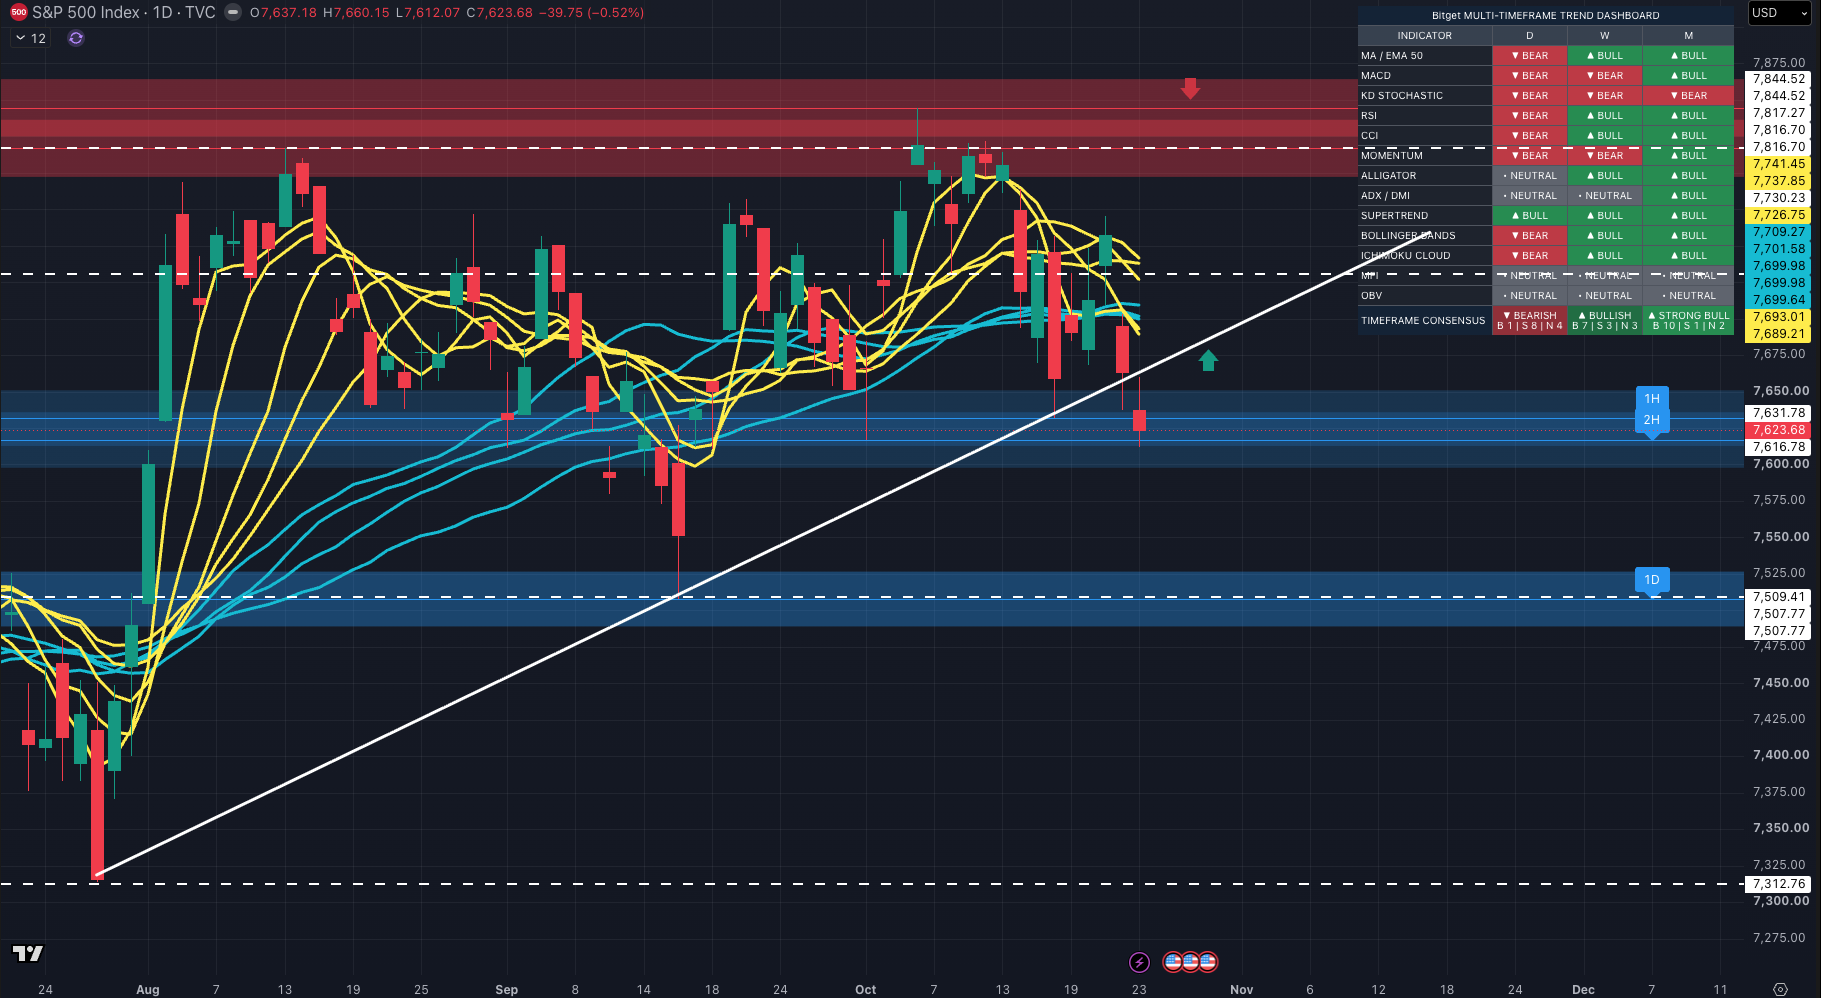
While gold faces rate pressure, US equities are also undergoing an important test.
The S&P 500 remains near record highs, suggesting that the broader bullish structure is still intact. However, from a market-breadth perspective, the rally appears to be heavily concentrated in a small group of mega-cap technology and AI-related stocks.
According to market statistics, around 59% of S&P 500 constituents remain at least 20% below their respective all-time highs, while approximately 84% are at least 10% below their peaks. More notably, roughly 10 stocks have contributed the majority of the S&P 500’s gains since the market rebounded from its lows.
This highlights an important reality: A strong index does not necessarily mean that most stocks are strong.
Because US500 is market-cap weighted, it is heavily influenced by large-cap stocks. When technology giants such as Nvidia, Apple, and Microsoft rise, the index can remain resilient even while many smaller constituents stay in correction territory.
This concentration can help extend the rally, but it also amplifies risk. If heavyweight technology stocks begin to see profit-taking, volatility in US500 could increase rapidly.
Concerns Over AI Spending Are Rising: Selling Pressure Is Spreading Across Technology Stocks
Markets have not turned completely bearish on AI’s long-term outlook. However, investors are beginning to ask more demanding questions:
When will massive AI capital expenditure translate into sufficient revenue and profit growth?
Major technology companies continue to invest heavily in AI models, data centres, semiconductors, and cloud infrastructure, with spending often reaching hundreds of billions of dollars. Markets have previously supported elevated valuations because they believed AI would drive long-term productivity gains and earnings growth. But as financing needs, capital expenditure, and investment payback periods come under greater scrutiny, valuations may face a repricing.
The recent technology sell-off has also affected hedge funds with concentrated AI-related exposure. Data shows that fundamental long/short, systematic long/short, and multi-strategy funds have all fallen by more than 1% on the same trading day—an uncommon broad-based stress event since the pandemic.
This is not simply a decline in technology stocks. It is a chain reaction driven by liquidity conditions and leverage adjustments:
-
AI and semiconductor positions have become overly concentrated;
-
Funds are reducing leverage and cutting risk exposure;
-
Some short positions have faced short squeezes;
-
Selling pressure is spreading from US technology stocks to Asian AI supply-chain names.
In this type of market environment, declines can become self-reinforcing. When many institutions hold similar popular assets, selling pressure can rapidly intensify once deleveraging begins.
What Should US500 Traders Watch This Week?
For US500 CFD traders, the key issue this week is not only whether the index can hold near its highs, but also whether underlying market conditions are improving or deteriorating.
Five key signals to monitor:
1. Can Mega-Cap Technology Stocks Stabilise?
Nvidia, Meta, Apple, Microsoft, and other heavyweight stocks remain important directional indicators for US500. If they continue to weaken, the index may come under greater pressure.
2. Is Market Breadth Expanding?
If more sectors—including financials, industrials, small caps, and value stocks—begin participating in the rally, the bullish structure may become healthier. If gains remain concentrated in only a few names, market fragility should be monitored closely.
3. Corporate Earnings and AI Capital-Expenditure Guidance
Markets are not only assessing revenue and earnings. Investors are also watching how companies address AI investment, capital spending, financing needs, and expected future returns.
4. Inflation, Oil Prices, and Interest-Rate Expectations
Rising oil prices and inflation concerns may push yields higher and pressure technology valuations, particularly in high-growth sectors.
5. Volatility and Key Technical Levels
If US500 breaks higher without support from market breadth and trading momentum, traders should remain alert to the risk of a false breakout. If support levels fail during a pullback, selling pressure could accelerate.
In a High-Volatility Market, Position Management Matters as Much as Direction
This week’s market environment is a reminder that gold, US equities, and technology shares are no longer being driven by a single narrative.
XAUUSD must contend with oil prices, inflation, the US dollar, and Fed policy expectations. US500, meanwhile, must absorb questions surrounding AI valuations, earnings, concentration in heavyweight stocks, and market breadth.
During periods of elevated volatility, traders may benefit from building a clear trading framework rather than simply betting on higher or lower prices:
-
Identify key support and resistance levels;
-
Monitor the timing of major economic data releases and earnings reports;
-
Avoid excessive leverage when volatility expands;
-
Set stop-loss levels, profit targets, and position-size limits for each trade;
-
Adjust market views as conditions change rather than becoming committed to a single direction.
Capture XAUUSD and US500 Volatility Opportunities
With gold falling below $4,000 and technology stocks facing an AI valuation test, markets are entering a phase that requires greater flexibility. Whether you are watching for gold to reclaim key levels or looking to navigate two-way opportunities in US equity-index volatility, you can follow and trade XAUUSD and US500 through Bitget CFD, positioning according to your own market view.
Visit Bitget CFD today to explore XAUUSD and US500 trading opportunities, and manage this week’s market volatility with disciplined risk management.
All trading education provided by Bitget is for educational purposes only and should not be considered financial advice. The strategies and examples shared are for reference only and may not reflect actual market conditions. CFD trading involves significant risk, including the potential loss of capital. Past performance does not guarantee future results. Please conduct thorough research and ensure that you understand the risks involved. Bitget is not responsible for any trading decisions made by users.


- Gold Falls Below $4,000: The Market Is Trading Rate Risk, Not Just Safe-Haven Demand
- XAUUSD Focus This Week: Can Gold Reclaim $4,000?
- US500 Near Highs, but the Market May Be Weaker Than It Appears
- Concerns Over AI Spending Are Rising: Selling Pressure Is Spreading Across Technology Stocks
- What Should US500 Traders Watch This Week?
- In a High-Volatility Market, Position Management Matters as Much as Direction